
Do Teacher Pay, Funding, and Enrollment Decide a Texas District’s Grade?
Do Teacher Pay, Funding, and Enrollment Decide a Texas District’s Grade?
A district-by-district look at how per-student funding, average teacher pay, and district size line up with the 2024 A–F grades of 1,187 Texas school systems, and at what does line up with those grades, with a 10-year look back to 2014–15.
The Question and the Data
What was measured, for whom, and from which records
Debates about Texas schools often assume that districts earn better grades when they spend more per student, pay teachers more, or reach a certain size. Those assumptions can be tested. The Texas Education Agency publishes an A–F grade for nearly every school system, along with each system’s revenue, attendance, student characteristics, and teacher pay. This article puts those records side by side for the 2023–24 school year.
Five official TEA files were used. They are the 2024 accountability ratings (Texas Education Agency, n.d.-d); actual FY2024 revenue and spending reported by each system (Texas Education Agency, n.d.-g); 2023–24 student and staff data from the Texas Academic Performance Reports (TAPR) (Texas Education Agency, n.d.-c); refined attendance counts from the final 2023–24 Summary of Finances (Texas Education Agency, n.d.-b); and TEA’s classification of each system by type (Texas Education Agency, n.d.-e). All 1,246 school systems that appear in any of these files were matched by their six-digit TEA district number. Of those, 1,187 had an A–F grade and complete funding, attendance, and teacher-pay data. That group includes 1,016 traditional school districts and 171 open-enrollment charter systems. The two groups are analyzed separately because they are funded and governed differently.
Overall score is the 0–100 score that determines a district’s letter grade (Texas Education Agency, 2024). Operating revenue is the state, local, and federal money a system received to run its schools in FY2024, as reported to TEA (Texas Education Agency, n.d.-g). Refined ADA (average daily attendance) is the attendance count TEA uses to calculate school funding (Texas Education Agency, n.d.-f). This article divides revenue by refined ADA to measure “funding per student in attendance,” and uses refined ADA to measure district size. Average teacher base salary is the district’s average base pay for teachers, as reported in TAPR (Texas Education Agency, n.d.-c).
To see whether the 2023–24 patterns are new or long-standing, the same measures were assembled for every school year from 2014–15 through 2023–24. The sources were TEA’s district profile files for each year (Texas Education Agency, n.d.-h; Texas Education Agency, n.d.-c), district revenue reported for FY2015 through FY2024 (Texas Education Agency, n.d.-g), and TEA’s statewide summary of district and campus ratings and scores (Texas Education Agency, n.d.-a; Texas Education Agency, n.d.-d). That produced 10,214 district-year records for traditional districts. Dollar amounts from earlier years are converted to FY2024 dollars using the federal Consumer Price Index (U.S. Bureau of Labor Statistics, 2026), so a dollar in 2014–15 is compared with what it would buy in 2023–24.
The grading system changed several times during these ten years, and every over-time comparison has to account for that. Districts were rated only Met Standard or Improvement Required from 2014–15 through 2016–17. Letter grades began in 2017–18. No ratings were issued for 2019–20 or 2020–21 because of the pandemic. In 2021–22, districts that would have received a D or F were labeled Not Rated instead. TEA then revised the scoring rules beginning in 2022–23 (Texas Education Agency, n.d.-a; Texas Education Agency, 2024). Because scores before and after that change are not directly comparable, the over-time analysis uses each district’s percentile rank, its standing relative to other traditional districts in the same year, rather than its raw score. Historical funding is measured per enrolled student, because fall enrollment is reported the same way in every year.
The results describe how these measures line up across districts in one school year. They do not prove that any one factor causes a grade. Section 7 compares districts with similar students, and also follows the same districts over time to see whether changes in funding, pay, or enrollment moved with changes in their standing.
How Districts Were Graded
The distribution of 2024 letter grades
Under the 2024 accountability system, a district’s overall score combines three areas: Student Achievement, School Progress, and Closing the Gaps. The score is then converted to a letter grade (Texas Education Agency, 2024). Among the 1,016 traditional districts in this analysis, 106 earned an A, 390 a B, 354 a C, 151 a D, and 15 an F. Among the 171 charter systems, 26 earned an A, 53 a B, 38 a C, 30 a D, and 24 an F (Texas Education Agency, n.d.-d). The median traditional district scored 79.
Grades Over Ten Years
District grades have shifted sharply over the decade, partly because of changes in the rules themselves. From 2014–15 through 2016–17, 96% to 97% of traditional districts were rated Met Standard. In 2017–18, the first year of letter grades, 61% of districts that received a letter earned an A or B; TEA labeled another 194 traditional districts Met Standard that year instead of assigning a letter. The share of A or B grades rose to 86% in 2018–19 and 91% in 2021–22, when D and F labels were not issued. It then fell to 52% in 2022–23 under the revised rules and 49% in 2023–24. The median overall score moved from 82 (2017–18) to 87 (2018–19), 87 (2021–22), 80 (2022–23), and 79 (2023–24) (Texas Education Agency, n.d.-a; Texas Education Agency, n.d.-d).
Of the 1,011 traditional districts with a letter grade in both 2018–19 and 2023–24, 347 kept the same letter, 599 received a lower letter, and 65 received a higher one (Texas Education Agency, n.d.-a; Texas Education Agency, n.d.-d). Because the rules changed between those years, a lower letter does not by itself mean a district’s students learned less. This is why the over-time sections compare districts by percentile rank.
Per-Student Funding and Grades
Do better-funded districts earn better grades?
The median traditional district received $16,752 in operating revenue per student in attendance, or $15,170 per enrolled student (Texas Education Agency, n.d.-g; Texas Education Agency, n.d.-b). Across all 1,016 traditional districts, funding per student in attendance has almost no relationship to the overall score. The correlation is 0.07, on a scale where 0 means no relationship and 1 means a perfect one. Measuring per enrolled student instead gives 0.09 (Texas Education Agency, n.d.-d; Texas Education Agency, n.d.-g; Texas Education Agency, n.d.-b). Letter grades account for only about 2.0% of the differences in funding between districts.
Median funding was $18,098 for A districts, $16,514 for B, $16,393 for C, $17,432 for D, and $19,604 for the 15 F districts (Texas Education Agency, n.d.-g; Texas Education Agency, n.d.-b; Texas Education Agency, n.d.-d). The highest- and lowest-graded districts both had above-median funding. That is a sign that something other than funding is driving the pattern. For charter systems the pattern runs the other way: higher funding per student goes with lower scores (correlation −0.27). One likely reason is that charters serving more economically disadvantaged students receive more formula aid and also tend to score lower (correlation with poverty −0.29) (Texas Education Agency, n.d.-d; Texas Education Agency, n.d.-g; Texas Education Agency, n.d.-b; Texas Education Agency, n.d.-c).
Grouping traditional districts into five equal-sized funding groups shows the same thing. Of the lowest-funded group, 56% earned an A or B, compared with 39% of the second group and 49% of the highest-funded group (Texas Education Agency, n.d.-d; Texas Education Agency, n.d.-g; Texas Education Agency, n.d.-b). The lowest-funded group is mostly larger districts, with a median of 5,204 students in attendance. The highest-funded group is mostly very small districts, with a median of 200. State formulas send extra money to small districts and to districts with more students in poverty. Funding levels therefore reflect who a district serves, which is why Section 7 compares districts with similar students.
Funding Over Ten Years
After inflation, median operating revenue per enrolled student in traditional districts rose from $13,602 in 2014–15 to a high of $15,962 in 2021–22, then eased to $15,180 in 2023–24. That is a real increase of 11.6% over the decade; in dollars of the day, the 2014–15 figure was $10,356 (Texas Education Agency, n.d.-g; U.S. Bureau of Labor Statistics, 2026). Part of the 2020–21 through 2022–23 rise was temporary federal pandemic aid. Median federal revenue per enrolled student went from $1,466 in 2018–19 to $2,870 in 2021–22 and back to $1,825 in 2023–24, all in FY2024 dollars (Texas Education Agency, n.d.-g; U.S. Bureau of Labor Statistics, 2026).
Through all of those changes, funding per student never lined up with grades across districts. In each of the five letter-grade years, the correlation between funding per enrolled student and the overall score stayed between −0.04 to 0.09 (Texas Education Agency, n.d.-a; Texas Education Agency, n.d.-d; Texas Education Agency, n.d.-g). The over-time picture adds something the single year could not show, however. When the same districts are followed from 2018–19 to 2023–24, those whose real funding per student grew the most (median +27%) changed their median percentile rank by +1.3 points. Those whose funding fell the most (median −10%) changed theirs by −5.1 points (Texas Education Agency, n.d.-a; Texas Education Agency, n.d.-d; Texas Education Agency, n.d.-g; U.S. Bureau of Labor Statistics, 2026).
Holding changes in teacher pay, enrollment, and student poverty constant, along with each district’s 2018–19 standing, a 10% increase in real funding per student from 2018–19 to 2023–24 went with about 1.5 percentile points of improvement in rank (Texas Education Agency, n.d.-a; Texas Education Agency, n.d.-d; Texas Education Agency, n.d.-g; Texas Education Agency, n.d.-c). The relationship is real but modest, and it is consistent with the single-year finding in Section 7.
Teacher Pay and Grades
Do districts that pay teachers more earn better grades?
The median traditional district paid an average teacher base salary of $56,547 (Texas Education Agency, n.d.-c). Across districts, average teacher pay shows almost no relationship to the overall score: the correlation is 0.05 (Texas Education Agency, n.d.-d; Texas Education Agency, n.d.-c). Median salary was $56,071 in A districts, $56,742 in B, $56,410 in C, $56,867 in D, and $52,558 in F districts. Statistically, the salary differences across letter grades are not distinguishable from chance (p = 0.12).
Sorted into five pay groups, the lowest-paying fifth of districts (median $50,534) earned an A or B 50% of the time. The highest-paying fifth (median $64,808) did so 51% of the time (Texas Education Agency, n.d.-d; Texas Education Agency, n.d.-c). The highest-paying districts are mostly large: their median size is 6,194 students in attendance, compared with 382 for the lowest-paying group. They also receive less operating revenue per student, $14,632 compared with $19,315 (Texas Education Agency, n.d.-c; Texas Education Agency, n.d.-b; Texas Education Agency, n.d.-g). Large districts can pay teachers more because their fixed costs are spread over more students. Small districts receive more per student but spread it across fewer teachers at lower average salaries.
Teacher pay also varies with local labor markets. Districts in and around large cities pay more than rural districts in the same part of the state. When districts are compared only with others of the same TEA district type and in the same education service center region, a pay relationship appears (Section 7) (Texas Education Agency, n.d.-e). Among charter systems, higher teacher pay goes with modestly higher scores (correlation 0.14), although that result falls just short of conventional statistical significance (p = 0.06) (Texas Education Agency, n.d.-d; Texas Education Agency, n.d.-c).
Teacher Pay Over Ten Years
Over the decade, the median district’s average teacher base salary rose 25.9% in dollars of the day, from $44,927 in 2014–15 to $56,560 in 2023–24. After inflation, however, it fell −4.1%, from $59,009 to $56,560 in FY2024 dollars. Real pay peaked at $62,611 in 2019–20, then lost ground as prices rose faster than salaries (Texas Education Agency, n.d.-h; Texas Education Agency, n.d.-c; U.S. Bureau of Labor Statistics, 2026).
Teacher pay’s link to grades across districts has weakened. The correlation between average teacher salary and the overall score was 0.17 in 2017–18 and 0.17 in 2018–19, compared with 0.01 in 2022–23 and 0.05 in 2023–24 (Texas Education Agency, n.d.-a; Texas Education Agency, n.d.-d; Texas Education Agency, n.d.-h; Texas Education Agency, n.d.-c). Over time, districts whose real average salary rose the most from 2018–19 to 2023–24 (median +6%) changed their median percentile rank by +0.8 points. Those with the largest real declines (median −11%) changed theirs by −2.7 points. The rank-based correlation is 0.10.
When salary change and funding change are considered together, the salary change adds no clear relationship of its own (p = 0.38) (Texas Education Agency, n.d.-a; Texas Education Agency, n.d.-d; Texas Education Agency, n.d.-h; Texas Education Agency, n.d.-c; Texas Education Agency, n.d.-g). Districts that raised pay tended to be the same districts whose funding grew. Section 7 tests teacher pay within the same districts across all five letter-grade years.
Enrollment and District Size
Do bigger or smaller districts earn better grades?
Texas districts range from a few dozen students to more than 160,000 in attendance. The median traditional district has about 915 (Texas Education Agency, n.d.-b). Size has essentially no straight-line relationship with the overall score (correlation 0.01). A rank-based measure, which is less influenced by the very largest districts, shows a slight tendency for larger districts to score lower (−0.11) (Texas Education Agency, n.d.-d; Texas Education Agency, n.d.-b).
The size groups are not evenly matched on grades. The smallest three-fifths of districts earned an A or B about half the time or more. Mid-sized districts, with 1,348 to 3,966 students in attendance, had the lowest share of A and B grades (36%) and the highest share of D and F grades (21%). The largest districts, with 3,969 or more, had 47% rated A or B (Texas Education Agency, n.d.-d; Texas Education Agency, n.d.-b). Size also shapes the other two measures in opposite directions. The smallest districts had a median of $22,669 per student in attendance and $53,326 in average teacher pay. The largest had $13,497 and $63,142 (Texas Education Agency, n.d.-g; Texas Education Agency, n.d.-b; Texas Education Agency, n.d.-c).
Among traditional districts, the median A district had 403 students in attendance and the median D district had 1,385. The median F district had only 374 (Texas Education Agency, n.d.-b; Texas Education Agency, n.d.-d). Both the best and the worst grades are common among small districts. That makes size a poor predictor of a district’s grade on its own.
Enrollment Over Ten Years
Traditional districts enrolled 4.99 million students in fall 2014 and 5.09 million in fall 2023, an increase of 2.1%. Enrollment peaked at 5.14 million in 2019–20 and dropped to 4.99 million during the pandemic year. The median district stayed close to 1,000 students throughout, 977 in 2014–15 and 997 in 2023–24 (Texas Education Agency, n.d.-g).
District size never lined up with grades in any letter-grade year: correlations ranged from −0.03 to 0.08 (Texas Education Agency, n.d.-a; Texas Education Agency, n.d.-d; Texas Education Agency, n.d.-g). Growth did not line up with improvement either. From 2018–19 to 2023–24, the fastest-growing fifth of districts (median +18%) changed their median percentile rank by −3.7 points, and the fastest-shrinking fifth (median −14%) by −2.8. The rank-based correlation across all districts was −0.02 (p = 0.47), meaning no detectable relationship (Texas Education Agency, n.d.-a; Texas Education Agency, n.d.-d; Texas Education Agency, n.d.-g).
Student Need: The Factor That Lines Up With Grades
Poverty, at-risk status, and the A–F scale
Funding, teacher pay, and size each show little relationship with grades. The share of a district’s students who are economically disadvantaged shows a strong one: a correlation of −0.49. The share of students TEA identifies as at risk of dropping out shows a similar relationship (−0.44) (Texas Education Agency, n.d.-d; Texas Education Agency, n.d.-c). About 24% of the variation in districts’ poverty rates lines up with their letter grades, more than ten times the share for funding.
In the fifth of traditional districts with the fewest economically disadvantaged students, 83% earned an A or B and 2% earned a D or F. In the fifth with the most, 28% earned an A or B and 38% earned a D or F. Median scores fell from 86 to 74. This happened even though the highest-poverty districts received more funding per student in attendance, a median of $17,765 compared with $14,703 (Texas Education Agency, n.d.-d; Texas Education Agency, n.d.-c; Texas Education Agency, n.d.-g; Texas Education Agency, n.d.-b).
Student Need Over Ten Years
The median traditional district’s share of economically disadvantaged students rose from 57.2% in 2014–15 to 61.9% in 2023–24 (Texas Education Agency, n.d.-h; Texas Education Agency, n.d.-c). Its link to grades held steady. In each of the five letter-grade years, poverty had the strongest correlation with the overall score of any factor examined, ranging from −0.50 to −0.38. Funding, teacher pay, and size stayed near zero every year (Texas Education Agency, n.d.-a; Texas Education Agency, n.d.-d; Texas Education Agency, n.d.-h; Texas Education Agency, n.d.-c; Texas Education Agency, n.d.-g).
Changes in poverty within a district, by contrast, did not track changes in its standing. From 2018–19 to 2023–24, the rank-based correlation between a district’s change in economically disadvantaged share and its change in percentile rank was −0.03 (p = 0.37) (Texas Education Agency, n.d.-a; Texas Education Agency, n.d.-d; Texas Education Agency, n.d.-h; Texas Education Agency, n.d.-c). Poverty separates districts from one another, but these modest year-to-year shifts within a district were not large enough to move its relative standing.
Comparing Similar Districts
Funding, pay, and size after accounting for student need
Raw comparisons can hide relationships, because the state’s formulas give more money to districts with greater student need. Those same districts tend to score lower. A fairer question is this: among districts with similar students, do the ones with more funding, higher pay, or more students score differently? Regression analysis answers that by estimating each factor’s relationship with the score while holding the others constant. The models include each district’s shares of economically disadvantaged, emergent bilingual, and special education students, plus its size, average teacher pay, TEA district type, and education service center region.
Once student need is held constant, funding shows a positive but small relationship. Among comparable traditional districts, 10% more operating revenue per student in attendance goes with about 0.34 points higher on the 100-point overall score (95% confidence range: 0.07 to 0.61 points). Funding alone explains essentially none of the variation in scores (R² = 0.000). Adding student need raises that to 0.27, which shows that need, not funding, does most of the explaining (Texas Education Agency, n.d.-d; Texas Education Agency, n.d.-g; Texas Education Agency, n.d.-b; Texas Education Agency, n.d.-c).
Teacher pay shows a relationship only when districts are compared with others of the same type and region. On that basis, each additional $1,000 in average base salary goes with about 0.16 points higher (95% range: 0.05 to 0.26). Without the type and region comparison, the estimate is 0.05 points and is not statistically significant (p = 0.30) (Texas Education Agency, n.d.-d; Texas Education Agency, n.d.-c; Texas Education Agency, n.d.-e). District size shows no relationship once the other factors are included: a district twice as large differs by about 0.06 points (p = 0.84). By comparison, 10 more percentage points of economically disadvantaged students goes with about 2.7 points lower.
Among districts serving similar students, the funding and teacher-pay relationships are real but small. Raising funding per student by 10% is associated with roughly a third of a point on a 100-point scale. A $1,000 raise in average teacher pay is associated with less than a fifth of a point. When larger districts are given more weight in the model, the funding estimate is no longer statistically clear (p = 0.11), while the teacher-pay estimate remains (0.23 points, p = 0.016) (Texas Education Agency, n.d.-d; Texas Education Agency, n.d.-g; Texas Education Agency, n.d.-b; Texas Education Agency, n.d.-c).
Comparable Districts Over Ten Years
The same comparison was repeated for each letter-grade year, using funding per enrolled student and fall enrollment, the measures available in every year. In every year, more funding per student went with a modestly higher score among comparable districts. A 10% increase was associated with between 0.27 and 0.54 points, and every estimate was statistically significant (Texas Education Agency, n.d.-a; Texas Education Agency, n.d.-d; Texas Education Agency, n.d.-g; Texas Education Agency, n.d.-h; Texas Education Agency, n.d.-c). Teacher pay was not statistically significant in any single year under this version of the model; its 2023–24 estimate is 0.06 points per $1,000 (p = 0.24). That means the single-year teacher-pay result above depends on how size and funding are measured.
A stronger test follows each district against itself. Using all five letter-grade years, the analysis asked whether a district’s standing rose in years when its own funding, pay, or enrollment changed, setting aside differences between districts that do not change over time. On that basis, a 10% increase in a district’s real funding per student went with about 1.2 percentile points higher standing (p = 0.001). Each additional $1,000 in real average teacher salary went with about 0.39 points (p = 0.014). Ten percent enrollment growth went with about 1.0 point lower standing (p = 0.02). Changes in poverty share were not significant within districts (p = 0.46) (Texas Education Agency, n.d.-a; Texas Education Agency, n.d.-d; Texas Education Agency, n.d.-g; Texas Education Agency, n.d.-h; Texas Education Agency, n.d.-c).
Across districts, money and pay barely line up with grades, because the districts that receive the most money often serve the most students in poverty. Within the same district over time, increases in real funding and teacher pay go with small improvements in standing: about one percentile point for a 10% funding increase, and less than half a point for $1,000 in pay. These are associations, measured over years when the grading rules changed. They do not prove that the added dollars caused the improvement.
Grades Inside Districts
What one letter grade conceals
A district’s letter grade is a single summary of many campuses. Among the 306 traditional districts with five or more letter-graded campuses in 2023–24, the typical gap between the highest- and lowest-scoring campus was 24 points. In 38% of those districts (115 in all), at least one campus was rated A while another was rated D or F (Texas Education Agency, n.d.-d). Campuses that share the same school board, budget, salary schedule, and district grade can produce very different results. District-level averages for funding and pay cannot explain that difference.
A family choosing a school is choosing a campus, not a district average. TEA publishes campus-level grades and scores for every rated campus. Those results show more about a child’s school than the district’s overall letter grade or its spending per student (Texas Education Agency, n.d.-d).
Campus Gaps Over Time
Wide campus gaps are not new. Campuses first received letter grades in 2018–19. That year, 31% of traditional districts with five or more letter-graded campuses had both an A campus and a D or F campus, with a typical score gap of 23 points. The share was 38% in 2022–23 and 38% in 2023–24 (Texas Education Agency, n.d.-a; Texas Education Agency, n.d.-d). The 2021–22 year is omitted because D and F labels were not issued.
What the Evidence Supports
Conclusions, limits, and implications for how schools are governed
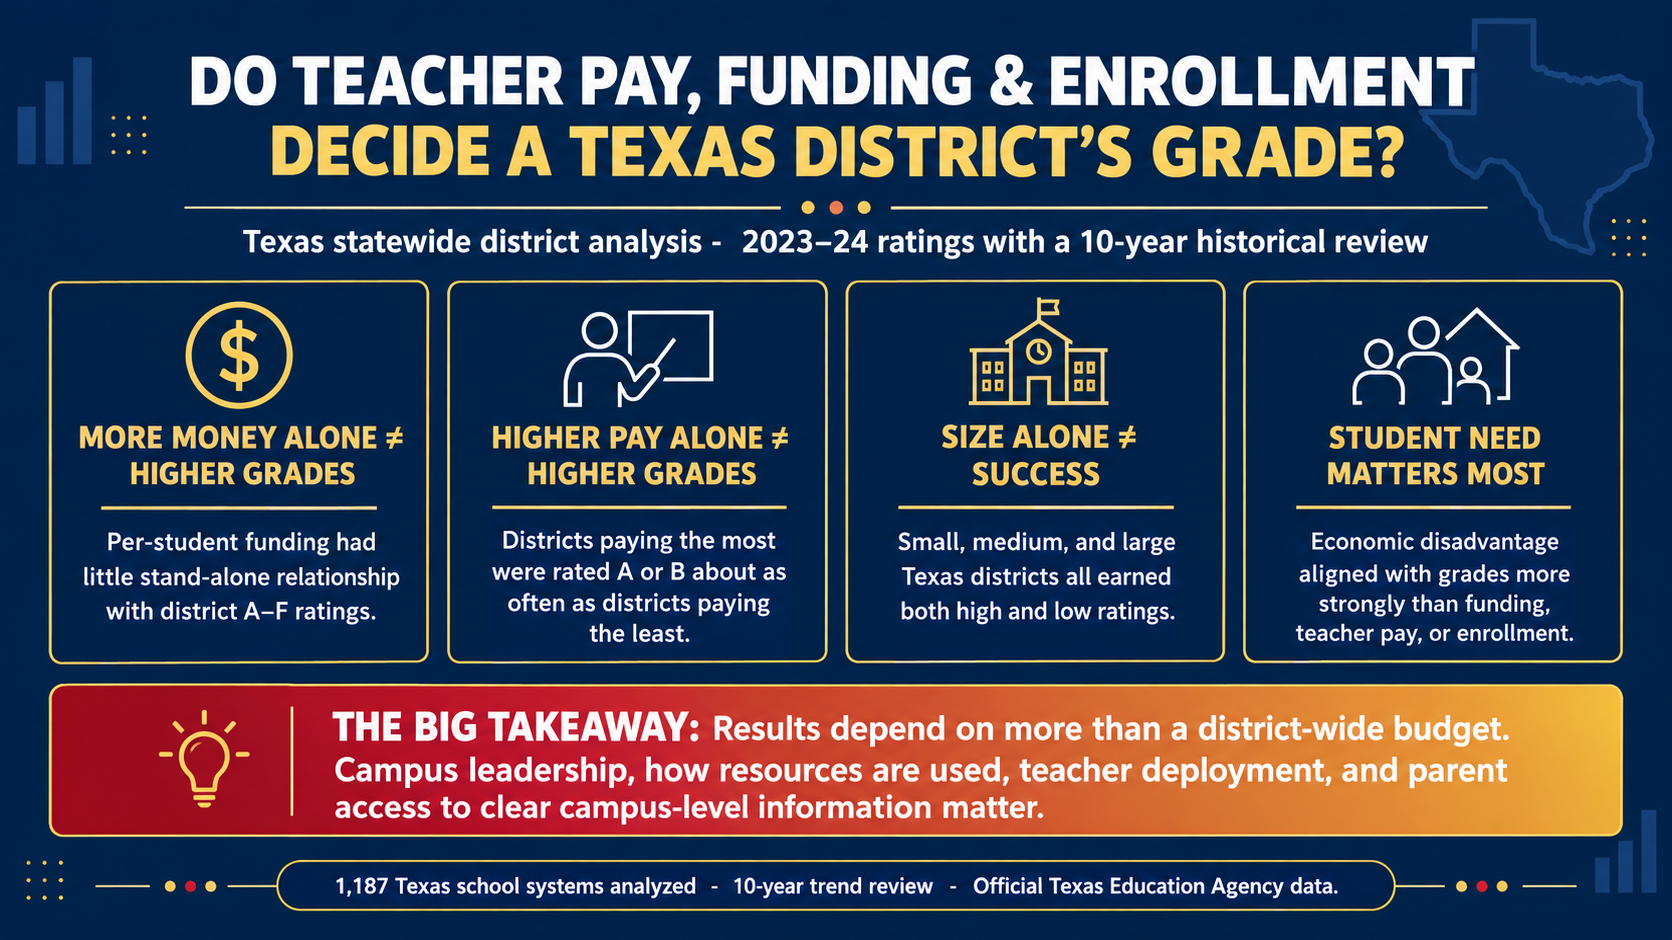
Across 1,187 Texas school systems in 2023–24, per-student funding, average teacher pay, and district size each had little relationship with a district’s A–F grade on their own. Districts with the most money per student were not the highest rated. Districts paying the highest average salaries were rated A or B about as often as those paying the least. Districts of every size earn both high and low grades. The measure that lines up most strongly with grades is how many of a district’s students come from economically disadvantaged families.
The 10-year record shows these are long-standing patterns, not features of a single year. In every letter-grade year since 2017–18, student poverty lined up with grades far more than funding, pay, or size did. Over the same decade, real funding per enrolled student in the median district rose 11.6%, while real average teacher pay fell −4.1% and enrollment grew 2.1%. Following the same districts over time, rising real funding and pay went with small gains in standing, and enrollment growth with a slight decline.
Once similar districts are compared, more funding and higher teacher pay are associated with modestly better scores. The size of those relationships matters for policy. If these relationships held, across-the-board increases in funding or salaries would be expected to move district scores only slightly. The large gaps between campuses within the same district suggest that results also depend on what happens at the campus and district level: how money is spent, how teachers are deployed, and how campuses are led. These records cannot measure those factors directly.
That is consistent with policies that put decisions and accountability closer to the campus, and that give parents clear campus-level information. It also argues against assuming that more money or higher pay by themselves will raise grades. The evidence does not show which governance changes would work best, and it does not show that local control by itself would improve results. Those questions require evidence across multiple years.
The central comparison covers a single year (2023–24). The 10-year extension spans changes to the grading rules, two unrated pandemic years, and a year without D and F labels, so it relies on percentile ranks rather than raw scores. All results measure associations, not causes. It uses district averages, which conceal differences between campuses and between teachers. Revenue is total operating revenue, not money spent in classrooms; instruction spending is reported separately in the data tables and shows the same pattern. Average teacher base salary reflects both pay scales and the experience of each district’s teachers. Refined ADA runs about 91% of fall enrollment statewide, so amounts per student in attendance are higher than amounts per enrolled student. The two should not be compared directly.
References
Sources are organized by the sections of this article they principally inform. Every source is an original government data file or official document.
Grades and Accountability — Sections 1, 2, and 6 through 8
Texas Education Agency. (n.d.-a). 2023 accountability ratings: Enhanced statewide summary, after appeal [Data set]. Retrieved October 11, 2026, from https://tea.texas.gov/school-and-district-leaders/accountability/academic-accountability/performance-reporting/2023-enhanced-statewide-summary-after-appeal-updated.xlsx
This is TEA’s statewide workbook of district and campus overall ratings from 2011 through 2023, with overall scores for 2018 through 2023. It is the source for every rating and score before 2023–24 and for the campus comparisons over time.
Texas Education Agency. (n.d.-d). 2024 accountability data download [Data set]. Retrieved October 10, 2026, from https://rptsvr1.tea.texas.gov/perfreport/account/acct_download.html?year=2024
These are the official district and campus accountability summary files for the 2023–24 school year: 1,207 districts and 9,082 campuses. They are the source for every 2023–24 A–F grade and overall score and for the 2023–24 campus comparisons.
Texas Education Agency. (2024). 2024 accountability manual. https://tea.texas.gov/school-and-district-leaders/accountability/academic-accountability/performance-reporting/2024-accountability-manual-full-4.pdf
This is the adopted rulebook for the 2024 A–F ratings. It defines the overall score; the Student Achievement, School Progress, and Closing the Gaps domains; and the cut points that convert scores to letter grades.
Funding, Attendance, and Prices — Sections 1, 3, 5, and 7
Texas Education Agency. (n.d.-b). 2023–2024 Summary of Finances, final [Data set]. Retrieved October 11, 2026, from https://tea.texas.gov/data-reports/financial-reports/school-finance-reports-and-data/2023-2024-sof-run-id-45525.xlsx
This is TEA’s final school-funding calculation for each system for 2023–24. It supplies refined average daily attendance, the denominator for 2023–24 funding per student in attendance and the measure of district size. The District Payment Estimate version was used, and each system’s final run identifier was retained.
Texas Education Agency. (n.d.-f). FY 2025 Summary of Finances data dictionary: State funding and FFA split. Retrieved October 10, 2026, from https://tea.texas.gov/about-tea/state-funding/fy-2025-summary-of-finance-data-dictionary-state-funding-and-ffa-split2.pdf
This is the official definition of each Summary of Finances field, including refined ADA and weighted ADA. It is used for the definitions in Section 1 and to select the correct fields.
Texas Education Agency. (n.d.-g). Summarized PEIMS actual financial data, 2008–09 through 2024–25 [Data set]. Retrieved October 10, 2026, from https://tea.texas.gov/about-tea/state-funding/state-funding-reports-and-data/peims-financial-data-downloads
This is the statewide file of revenue, spending, and fall enrollment that each district and charter school reports to TEA. FY2015 through FY2024 values supply operating revenue, federal revenue, and fall enrollment for the 10-year analysis, and FY2024 values supply the 2023–24 comparison. The workbook can be downloaded at https://tea.texas.gov/media/423296.
U.S. Bureau of Labor Statistics. (2026). Historical Consumer Price Index for All Urban Consumers (CPI-U): U.S. city average, all items, by month [Data set]. https://www.bls.gov/cpi/tables/supplemental-files/historical-cpi-u-202608.xlsx
This is the official federal measure of consumer price change, series CUUR0000SA0. Monthly values were averaged from September through August to match each Texas state fiscal year, and earlier dollar amounts were converted to FY2024 dollars.
Students, Teachers, and District Type — Sections 1 and 4 through 7
Texas Education Agency. (n.d.-c). 2023–24 Texas Academic Performance Report data download [Data set]. Retrieved October 10, 2026, from https://rptsvr1.tea.texas.gov/perfreport/tapr/tapr_dd_download.html?year=2024
This is the official 2023–24 district student and staff data. It supplies economically disadvantaged, at-risk, emergent bilingual, and special education shares, and average teacher base salary.
Texas Education Agency. (n.d.-e). District type, 2023–24 [Data set]. Retrieved October 11, 2026, from https://tea.texas.gov/data-reports/school-data/district-type-data-search/district-type-2023-24
This is TEA’s official classification of each system as major urban, major suburban, other central city, rural, charter, and similar categories. It separates charter systems from traditional districts and serves as a comparison control in Section 7.
Texas Education Agency. (n.d.-h). Texas Academic Performance Report data downloads, 2014–15 through 2022–23 [Data set]. Retrieved October 11, 2026, from https://rptsvr1.tea.texas.gov/perfreport/tapr/2019/download/DownloadData.html
These are TEA’s annual district profile downloads. The 2018–19 page is linked here; each other year uses the same address with its own year. They supply fall membership, economically disadvantaged, emergent bilingual, and special education shares, teacher full-time equivalents, and average teacher base salary for each year of the 10-year analysis.
Inspect the Data
The tables behind this article, one tab per dataset. Each table can be downloaded as a CSV file, and each tab explains how its figures were produced.
| Measure | Rating | Districts | Median | Mean | Mean, 3-SD Screened | 5th–95th Percentile |
|---|---|---|---|---|---|---|
| Operating revenue per refined ADA | A | 106 | $18,098 | $21,529 | $18,711 | $11,198–$36,707 |
| Operating revenue per refined ADA | B | 390 | $16,514 | $18,002 | $17,281 | $11,617–$27,456 |
| Operating revenue per refined ADA | C | 354 | $16,393 | $17,712 | $17,500 | $12,552–$26,516 |
| Operating revenue per refined ADA | D | 151 | $17,432 | $18,694 | $18,694 | $13,583–$28,006 |
| Operating revenue per refined ADA | F | 15 | $19,604 | $19,297 | $19,297 | $12,189–$26,941 |
| Operating revenue per refined ADA | All | 1016 | $16,752 | $18,391 | $17,745 | $12,019–$28,194 |
| Operating revenue per enrolled student | A | 106 | $16,433 | $19,774 | $17,084 | $10,570–$33,618 |
| Operating revenue per enrolled student | B | 390 | $15,144 | $16,438 | $15,830 | $10,763–$24,593 |
| Operating revenue per enrolled student | C | 354 | $14,832 | $15,997 | $15,721 | $11,540–$23,271 |
| Operating revenue per enrolled student | D | 151 | $15,211 | $16,578 | $16,578 | $12,181–$24,531 |
| Operating revenue per enrolled student | F | 15 | $16,921 | $17,391 | $17,391 | $13,064–$23,936 |
| Operating revenue per enrolled student | All | 1016 | $15,170 | $16,667 | $16,054 | $11,122–$25,383 |
| Average teacher base salary | A | 106 | $56,071 | $57,614 | $56,954 | $49,376–$68,510 |
| Average teacher base salary | B | 390 | $56,742 | $57,309 | $57,235 | $49,849–$66,964 |
| Average teacher base salary | C | 354 | $56,410 | $57,142 | $57,044 | $48,997–$66,702 |
| Average teacher base salary | D | 151 | $56,867 | $57,172 | $57,172 | $48,489–$66,396 |
| Average teacher base salary | F | 15 | $52,558 | $53,212 | $53,212 | $44,784–$63,082 |
| Average teacher base salary | All | 1016 | $56,547 | $57,202 | $57,071 | $49,028–$67,023 |
| Refined ADA (district size) | A | 106 | 403 | 2,622 | 2,051 | 88–9,745 |
| Refined ADA (district size) | B | 390 | 930 | 4,864 | 3,283 | 127–28,347 |
| Refined ADA (district size) | C | 354 | 1,068 | 5,445 | 3,266 | 119–24,397 |
| Refined ADA (district size) | D | 151 | 1,385 | 3,342 | 3,024 | 119–11,178 |
| Refined ADA (district size) | F | 15 | 374 | 1,770 | 1,770 | 96–9,354 |
| Refined ADA (district size) | All | 1016 | 915 | 4,561 | 3,084 | 119–22,343 |
| Economically disadvantaged share | A | 106 | 41.1% | 41.2% | 41.2% | 7.9%–72.8% |
| Economically disadvantaged share | B | 390 | 56.6% | 56.3% | 56.3% | 24.2%–86.1% |
| Economically disadvantaged share | C | 354 | 65.0% | 64.6% | 64.6% | 42.5%–88.0% |
| Economically disadvantaged share | D | 151 | 75.9% | 75.2% | 75.2% | 53.7%–93.0% |
| Economically disadvantaged share | F | 15 | 77.9% | 77.7% | 77.7% | 57.6%–96.5% |
| Economically disadvantaged share | All | 1016 | 61.9% | 60.7% | 60.7% | 24.9%–89.7% |
| Grouped By | Group | Range | Districts | Median Score | Rated A/B | Rated D/F | Median Revenue per ADA | Median Teacher Salary | Median Refined ADA | Median Econ. Disadv. |
|---|---|---|---|---|---|---|---|---|---|---|
| Revenue per ADA | Q1 | $3,747–$13,906 | 204 | 81 | 56.4% | 6.4% | $12,820 | $60,426 | 5,204 | 49.4% |
| Revenue per ADA | Q2 | $13,910–$15,923 | 203 | 77 | 38.9% | 20.2% | $15,051 | $57,724 | 1,744 | 63.5% |
| Revenue per ADA | Q3 | $15,930–$17,907 | 203 | 80 | 50.7% | 16.3% | $16,753 | $56,170 | 896 | 62.1% |
| Revenue per ADA | Q4 | $17,909–$20,656 | 203 | 79 | 49.3% | 18.7% | $19,177 | $54,845 | 437 | 64.5% |
| Revenue per ADA | Q5 | $20,665–$125,073 | 203 | 79 | 48.8% | 20.2% | $24,772 | $54,086 | 200 | 68.8% |
| Teacher base salary | Q1 | $42,526–$52,563 | 204 | 79 | 49.5% | 17.2% | $19,315 | $50,534 | 382 | 65.8% |
| Teacher base salary | Q2 | $52,564–$55,179 | 203 | 79 | 48.8% | 15.8% | $17,187 | $53,909 | 663 | 60.5% |
| Teacher base salary | Q3 | $55,187–$58,049 | 203 | 78 | 46.3% | 17.7% | $16,705 | $56,560 | 805 | 60.6% |
| Teacher base salary | Q4 | $58,072–$61,797 | 203 | 79 | 48.8% | 16.3% | $16,070 | $59,708 | 1,344 | 63.5% |
| Teacher base salary | Q5 | $61,868–$91,766 | 203 | 80 | 50.7% | 14.8% | $14,632 | $64,808 | 6,194 | 60.1% |
| Refined ADA | Q1 | 20–266 | 204 | 80 | 52.5% | 18.1% | $22,669 | $53,326 | 159 | 61.4% |
| Refined ADA | Q2 | 268–641 | 203 | 80 | 54.2% | 14.8% | $18,892 | $55,075 | 450 | 59.4% |
| Refined ADA | Q3 | 643–1,344 | 203 | 80 | 54.2% | 9.4% | $16,616 | $55,197 | 916 | 61.1% |
| Refined ADA | Q4 | 1,348–3,966 | 203 | 77 | 36.5% | 21.2% | $14,829 | $57,247 | 2,170 | 64.1% |
| Refined ADA | Q5 | 3,969–163,594 | 203 | 79 | 46.8% | 18.2% | $13,497 | $63,142 | 10,491 | 65.6% |
| Econ. disadvantaged | Q1 | 0.0%–46.0% | 205 | 86 | 83.4% | 2.0% | $14,703 | $57,649 | 1,013 | 35.6% |
| Econ. disadvantaged | Q2 | 46.2%–57.5% | 203 | 81 | 57.6% | 5.4% | $16,480 | $56,088 | 738 | 52.0% |
| Econ. disadvantaged | Q3 | 57.6%–67.4% | 204 | 78 | 42.6% | 11.3% | $16,691 | $55,748 | 812 | 62.0% |
| Econ. disadvantaged | Q4 | 67.5%–77.1% | 201 | 76 | 31.8% | 24.9% | $17,974 | $55,813 | 749 | 71.5% |
| Econ. disadvantaged | Q5 | 77.2%–100.0% | 203 | 74 | 28.1% | 38.4% | $17,765 | $57,484 | 1,463 | 85.0% |
| Factor | Traditional Pearson r | Traditional Spearman ρ | Traditional p | Charter Pearson r | Charter Spearman ρ | Charter p |
|---|---|---|---|---|---|---|
| Economically disadvantaged % | -0.487 | -0.470 | 0.000 | -0.289 | -0.280 | 0.000 |
| At-risk % | -0.439 | -0.473 | 0.000 | 0.093 | 0.059 | 0.224 |
| Emergent bilingual % | -0.194 | -0.220 | 0.000 | 0.021 | 0.047 | 0.788 |
| Special education % | -0.182 | -0.186 | 0.000 | -0.031 | -0.053 | 0.690 |
| Operating revenue per ADA | 0.065 | -0.018 | 0.038 | -0.275 | -0.350 | 0.000 |
| Operating revenue per enrolled student | 0.089 | 0.021 | 0.005 | -0.204 | -0.255 | 0.007 |
| Instruction spending per ADA | -0.000 | -0.026 | 0.999 | -0.250 | -0.257 | 0.001 |
| Avg. teacher base salary | 0.050 | 0.013 | 0.111 | 0.143 | 0.127 | 0.061 |
| District size (refined ADA) | 0.014 | -0.107 | 0.660 | 0.078 | 0.173 | 0.310 |
| Model | Weighting | Factor | Points per Unit | 95% Confidence Interval | p-value | Districts |
|---|---|---|---|---|---|---|
| M1 bivariate funding | District-weighted | Operating revenue per refined ADA (natural log) | 0.540 | -1.396 to 2.476 | 0.585 | 1016 |
| M2 + student need | District-weighted | Operating revenue per refined ADA (natural log) | 4.523 | 2.769 to 6.277 | 0.000 | 1016 |
| M2 + student need | District-weighted | Economically disadvantaged (percentage points) | -0.232 | -0.262 to -0.202 | 0.000 | 1016 |
| M2 + student need | District-weighted | Emergent bilingual (percentage points) | 0.030 | -0.019 to 0.079 | 0.225 | 1016 |
| M2 + student need | District-weighted | Special education (percentage points) | -0.272 | -0.420 to -0.124 | 0.000 | 1016 |
| M3 + size, salary | District-weighted | Operating revenue per refined ADA (natural log) | 4.286 | 1.941 to 6.631 | 0.000 | 1016 |
| M3 + size, salary | District-weighted | Economically disadvantaged (percentage points) | -0.230 | -0.260 to -0.199 | 0.000 | 1016 |
| M3 + size, salary | District-weighted | Emergent bilingual (percentage points) | 0.029 | -0.026 to 0.084 | 0.304 | 1016 |
| M3 + size, salary | District-weighted | Special education (percentage points) | -0.268 | -0.416 to -0.119 | 0.000 | 1016 |
| M3 + size, salary | District-weighted | District size, refined ADA (natural log) | -0.115 | -0.602 to 0.371 | 0.642 | 1016 |
| M3 + size, salary | District-weighted | Average teacher base salary (per $1,000) | 0.049 | -0.044 to 0.143 | 0.303 | 1016 |
| M4 + district type, region | District-weighted | Operating revenue per refined ADA (natural log) | 3.564 | 0.696 to 6.431 | 0.015 | 1016 |
| M4 + district type, region | District-weighted | Economically disadvantaged (percentage points) | -0.268 | -0.301 to -0.234 | 0.000 | 1016 |
| M4 + district type, region | District-weighted | Emergent bilingual (percentage points) | 0.040 | -0.016 to 0.096 | 0.159 | 1016 |
| M4 + district type, region | District-weighted | Special education (percentage points) | -0.217 | -0.377 to -0.056 | 0.008 | 1016 |
| M4 + district type, region | District-weighted | District size, refined ADA (natural log) | 0.089 | -0.763 to 0.941 | 0.838 | 1016 |
| M4 + district type, region | District-weighted | Average teacher base salary (per $1,000) | 0.158 | 0.053 to 0.263 | 0.003 | 1016 |
| M1 bivariate funding | ADA-weighted | Operating revenue per refined ADA (natural log) | -12.830 | -17.525 to -8.136 | 0.000 | 1016 |
| M2 + student need | ADA-weighted | Operating revenue per refined ADA (natural log) | 4.749 | -0.168 to 9.667 | 0.058 | 1016 |
| M2 + student need | ADA-weighted | Economically disadvantaged (percentage points) | -0.261 | -0.311 to -0.211 | 0.000 | 1016 |
| M2 + student need | ADA-weighted | Emergent bilingual (percentage points) | 0.153 | 0.075 to 0.231 | 0.000 | 1016 |
| M2 + student need | ADA-weighted | Special education (percentage points) | -0.096 | -0.439 to 0.247 | 0.584 | 1016 |
| M3 + size, salary | ADA-weighted | Operating revenue per refined ADA (natural log) | 6.295 | 0.594 to 11.996 | 0.030 | 1016 |
| M3 + size, salary | ADA-weighted | Economically disadvantaged (percentage points) | -0.257 | -0.307 to -0.208 | 0.000 | 1016 |
| M3 + size, salary | ADA-weighted | Emergent bilingual (percentage points) | 0.125 | 0.033 to 0.217 | 0.007 | 1016 |
| M3 + size, salary | ADA-weighted | Special education (percentage points) | -0.059 | -0.399 to 0.280 | 0.731 | 1016 |
| M3 + size, salary | ADA-weighted | District size, refined ADA (natural log) | 0.059 | -0.637 to 0.755 | 0.868 | 1016 |
| M3 + size, salary | ADA-weighted | Average teacher base salary (per $1,000) | 0.143 | -0.041 to 0.328 | 0.127 | 1016 |
| M4 + district type, region | ADA-weighted | Operating revenue per refined ADA (natural log) | 4.024 | -0.957 to 9.005 | 0.113 | 1016 |
| M4 + district type, region | ADA-weighted | Economically disadvantaged (percentage points) | -0.306 | -0.345 to -0.266 | 0.000 | 1016 |
| M4 + district type, region | ADA-weighted | Emergent bilingual (percentage points) | 0.077 | 0.006 to 0.149 | 0.034 | 1016 |
| M4 + district type, region | ADA-weighted | Special education (percentage points) | 0.068 | -0.180 to 0.316 | 0.590 | 1016 |
| M4 + district type, region | ADA-weighted | District size, refined ADA (natural log) | 0.002 | -0.910 to 0.915 | 0.996 | 1016 |
| M4 + district type, region | ADA-weighted | Average teacher base salary (per $1,000) | 0.234 | 0.043 to 0.424 | 0.016 | 1016 |
| School Year | Districts | Fall Enrollment | Median District Enrollment | Median Revenue per Enrolled Student | Same, FY2024 $ | Median Avg. Teacher Salary | Same, FY2024 $ | Median Econ. Disadv. | Rated A or B | Median Overall Score |
|---|---|---|---|---|---|---|---|---|---|---|
| 2014–15 | 1,023 | 4,987,451 | 977 | $10,356 | $13,602 | $44,927 | $59,009 | 57.2% | — | — |
| 2015–16 | 1,023 | 5,028,214 | 975 | $10,546 | $13,741 | $45,669 | $59,506 | 58.0% | — | — |
| 2016–17 | 1,023 | 5,071,208 | 989 | $10,566 | $13,498 | $45,965 | $58,724 | 59.3% | — | — |
| 2017–18 | 1,023 | 5,088,860 | 1,001 | $11,049 | $13,783 | $46,618 | $58,152 | 60.0% | 454 | 82 |
| 2018–19 | 1,022 | 5,099,684 | 1,006 | $11,691 | $14,312 | $47,460 | $58,098 | 61.5% | 874 | 87 |
| 2019–20 | 1,020 | 5,141,129 | 994 | $12,636 | $15,246 | $51,892 | $62,611 | 60.5% | — | — |
| 2020–21 | 1,020 | 4,993,065 | 961 | $13,516 | $15,833 | $52,300 | $61,266 | 60.2% | — | — |
| 2021–22 | 1,021 | 5,024,869 | 993 | $14,673 | $15,962 | $53,381 | $58,070 | 60.5% | 907 | 87 |
| 2022–23 | 1,020 | 5,099,566 | 1,004 | $15,044 | $15,523 | $54,857 | $56,601 | 62.2% | 528 | 80 |
| 2023–24 | 1,019 | 5,093,875 | 997 | $15,180 | $15,180 | $56,560 | $56,560 | 61.9% | 496 | 79 |
| Factor (Traditional Districts) | 2017–18 | 2018–19 | 2021–22 | 2022–23 | 2023–24 |
|---|---|---|---|---|---|
| Revenue per enrolled student (FY2024 $) | 0.029 | -0.035 | 0.022 | 0.089 | 0.089 |
| Avg. teacher base salary (FY2024 $) | 0.170 | 0.169 | 0.089 | 0.009 | 0.050 |
| Fall enrollment | 0.083 | 0.067 | -0.003 | -0.033 | 0.010 |
| Economically disadvantaged % | -0.461 | -0.444 | -0.380 | -0.500 | -0.487 |
| Model | Years | Factor | Coefficient | 95% Confidence Interval | p-value | Districts / Obs. |
|---|---|---|---|---|---|---|
| Cross-section | 2018 | Revenue per enrolled student, FY2024 $ (natural log) | 5.667 | 2.277 to 9.057 | 0.001 | 1016 |
| Cross-section | 2018 | Avg. teacher base salary, FY2024 $ (per $1,000) | 0.024 | -0.088 to 0.136 | 0.674 | 1016 |
| Cross-section | 2018 | Fall enrollment (natural log) | 0.909 | 0.077 to 1.741 | 0.032 | 1016 |
| Cross-section | 2018 | Economically disadvantaged (points) | -0.229 | -0.259 to -0.199 | 0.000 | 1016 |
| Cross-section | 2019 | Revenue per enrolled student, FY2024 $ (natural log) | 2.860 | 0.517 to 5.203 | 0.017 | 1016 |
| Cross-section | 2019 | Avg. teacher base salary, FY2024 $ (per $1,000) | -0.006 | -0.089 to 0.078 | 0.896 | 1016 |
| Cross-section | 2019 | Fall enrollment (natural log) | 1.405 | 0.752 to 2.058 | 0.000 | 1016 |
| Cross-section | 2019 | Economically disadvantaged (points) | -0.158 | -0.183 to -0.134 | 0.000 | 1016 |
| Cross-section | 2022 | Revenue per enrolled student, FY2024 $ (natural log) | 4.297 | 1.998 to 6.597 | 0.000 | 1018 |
| Cross-section | 2022 | Avg. teacher base salary, FY2024 $ (per $1,000) | 0.064 | -0.023 to 0.152 | 0.148 | 1018 |
| Cross-section | 2022 | Fall enrollment (natural log) | 0.913 | 0.305 to 1.522 | 0.003 | 1018 |
| Cross-section | 2022 | Economically disadvantaged (points) | -0.136 | -0.160 to -0.113 | 0.000 | 1018 |
| Cross-section | 2023 | Revenue per enrolled student, FY2024 $ (natural log) | 4.169 | 1.946 to 6.391 | 0.000 | 1018 |
| Cross-section | 2023 | Avg. teacher base salary, FY2024 $ (per $1,000) | -0.013 | -0.103 to 0.076 | 0.768 | 1018 |
| Cross-section | 2023 | Fall enrollment (natural log) | 0.535 | -0.175 to 1.245 | 0.140 | 1018 |
| Cross-section | 2023 | Economically disadvantaged (points) | -0.236 | -0.266 to -0.206 | 0.000 | 1018 |
| Cross-section | 2024 | Revenue per enrolled student, FY2024 $ (natural log) | 4.562 | 1.974 to 7.150 | 0.001 | 1016 |
| Cross-section | 2024 | Avg. teacher base salary, FY2024 $ (per $1,000) | 0.057 | -0.037 to 0.150 | 0.236 | 1016 |
| Cross-section | 2024 | Fall enrollment (natural log) | 0.383 | -0.474 to 1.239 | 0.381 | 1016 |
| Cross-section | 2024 | Economically disadvantaged (points) | -0.227 | -0.258 to -0.197 | 0.000 | 1016 |
| District fixed effects, percentile rank | 2018-2024 (A-F years) | Revenue per enrolled student, FY2024 $ (natural log) | 12.136 | 4.989 to 19.282 | 0.001 | 5084 |
| District fixed effects, percentile rank | 2018-2024 (A-F years) | Avg. teacher base salary, FY2024 $ (per $1,000) | 0.394 | 0.079 to 0.709 | 0.014 | 5084 |
| District fixed effects, percentile rank | 2018-2024 (A-F years) | Fall enrollment (natural log) | -10.654 | -19.723 to -1.585 | 0.021 | 5084 |
| District fixed effects, percentile rank | 2018-2024 (A-F years) | Economically disadvantaged (points) | 0.059 | -0.099 to 0.217 | 0.463 | 5084 |
| District fixed effects, percentile rank | 2018-2024 (A-F years) | Emergent bilingual (points) | -0.567 | -0.969 to -0.166 | 0.006 | 5084 |
| District fixed effects, percentile rank | 2018-2024 (A-F years) | Special education (points) | -0.201 | -0.663 to 0.260 | 0.393 | 5084 |
| Change model, percentile rank | 2019–2024 | Change in real revenue per student (%) | 0.149 | 0.071 to 0.228 | 0.000 | 1011 |
| Change model, percentile rank | 2019–2024 | Change in real avg. teacher salary (%) | 0.083 | -0.104 to 0.270 | 0.384 | 1011 |
| Change model, percentile rank | 2019–2024 | Change in fall enrollment (%) | -0.029 | -0.116 to 0.058 | 0.516 | 1011 |
| Change model, percentile rank | 2019–2024 | Change in econ. disadvantaged (points) | -0.139 | -0.366 to 0.089 | 0.232 | 1011 |
| Change model, percentile rank | 2019–2024 | 2019 percentile rank | -0.385 | -0.432 to -0.337 | 0.000 | 1011 |
| Data Element | Source | Original File | Accessed |
|---|---|---|---|
| 2024 district and campus A–F ratings and scores | Texas Education Agency, accountability data download | TEA_2024_accountability_district_summary.csv; TEA_2024_accountability_campus_summary.csv | 2026-10-10 |
| Rating rules and score definitions | Texas Education Agency, 2024 Accountability Manual | TEA_2024_manual.pdf | 2026-10-10 |
| Student characteristics and teacher pay, 2023–24 | Texas Education Agency, TAPR data download | TEA_TAPR_2023-24_District_*_Original.csv | 2026-10-10 |
| District revenue and spending, FY2024 | Texas Education Agency, Summarized PEIMS Actual Financial Data | tea-peims-summarized-actual-2009-2025.xlsx | 2026-10-10 |
| Refined ADA and weighted ADA, 2023–24 | Texas Education Agency, Summary of Finances (final) | 2023-2024-sof-run-id-45525.xlsx | 2026-10-11 |
| Summary of Finances field definitions | Texas Education Agency, SOF data dictionary | fy-2025-summary-of-finance-data-dictionary.pdf | 2026-10-11 |
| District type classification, 2023–24 | Texas Education Agency, District Type Data | district-type2324-0.xlsx | 2026-10-11 |
| District and campus ratings and scores, 2011–2023 | Texas Education Agency, 2023 enhanced statewide summary (after appeal) | 2023-enhanced-statewide-summary-after-appeal-updated.xlsx | 2026-10-11 |
| District students, staff, and teacher pay, 2014–15 to 2022–23 | Texas Education Agency, TAPR data downloads (district profile and reference) | tapr_2015_D_PROF.csv … tapr_2023_D_REF.csv (18 files) | 2026-10-11 |
| District revenue and fall enrollment, FY2015–FY2023 | Texas Education Agency, Summarized PEIMS Actual Financial Data | tea-peims-summarized-actual-2009-2025.xlsx | 2026-10-10 |
| Consumer Price Index (CPI-U), monthly | U.S. Bureau of Labor Statistics | bls_cpi_u_us_city_average_monthly_2005_2026.csv | 2026-10-11 |