
Texas Education Spending: A Decade of Evidence That More Spending Does Not Equal Better Outcomes
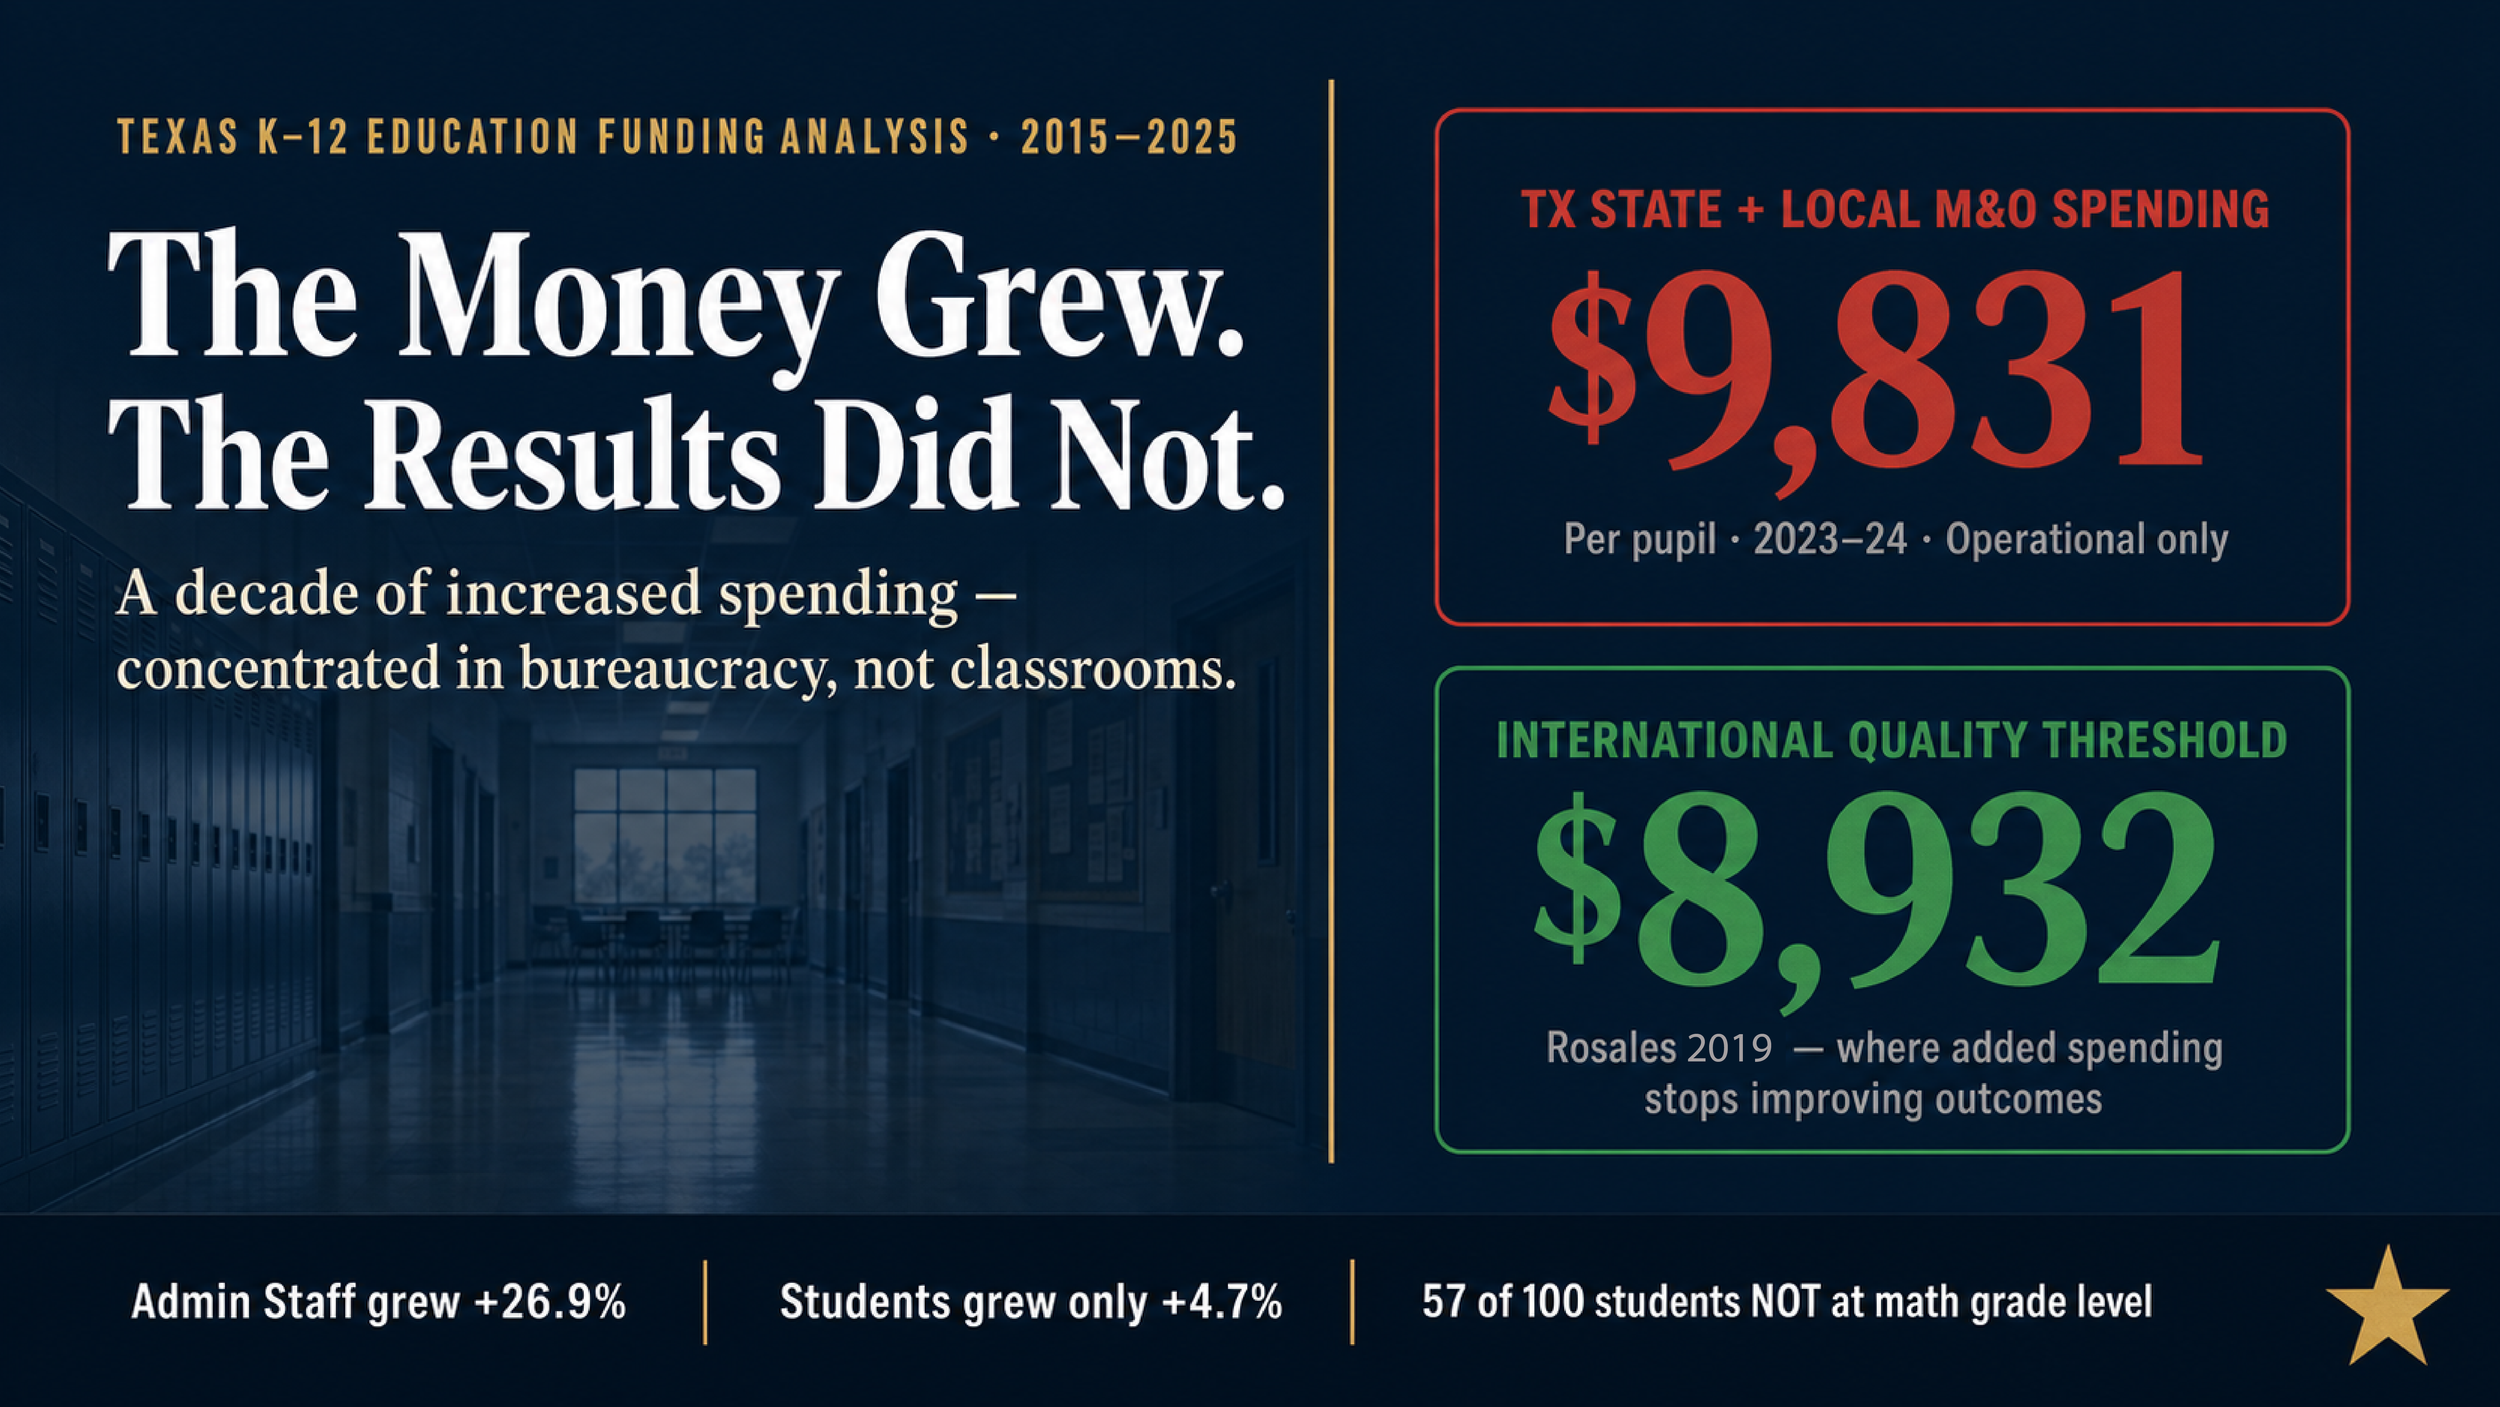
Texas Education Policy Analysis · 2015–2025
The Money Grew. The Bureaucracy Grew. The Results Did Not.
A decade of Texas K–12 education funding — where the dollars went, who benefited, and what students actually got for it. A data-driven review of per-pupil spending, administrative bloat, workforce outcomes, and student achievement from 2014–15 through 2024–25, with legislative updates from the 89th Texas Legislature.
Introduction & Executive Summary
What this analysis examines — and what the data reveals
Over the past decade, Texas has dramatically increased what it spends on public education. Per-pupil operating expenditures rose from $8,558 in 2014–15 to $11,055 in 2023–24 — a 29% increase that, on its face, represents a substantial investment in the state's 5.5 million public school students.[1] All-sources per-pupil spending, counting federal, state, and local dollars together, reached $18,972 per student in 2024–25 according to official Texas Education Agency financial reporting.[2] In total, Texas spent $104.89 billion on K–12 education in 2024–25 across all funding streams.[3] By any measure, spending went up — significantly and consistently.
But spending more money and educating children better are not the same thing. This analysis examines exactly where the money went, who benefited most, and what students actually received in return — measured not by budget line items but by the only metric that ultimately matters: whether children are learning to read and do math at grade level.
The findings are troubling, and they are grounded entirely in official data from the Texas Education Agency, the National Center for Education Statistics, the National Assessment of Educational Progress, and related state and federal sources. Here is what the data shows:
Texas increased per-pupil spending by 29% over ten years. Administrative staffing grew at more than five times the rate of student enrollment. Teacher pay grew at roughly half the rate of administrator pay. And as of Spring 2025, 57 out of every 100 Texas public school students are not meeting grade-level standards in mathematics — a statistic that has barely moved despite a decade of increasing investment.
What This Report Covers
Section 1 — The K–12 Population Landscape: Texas educates more than 6.7 million K–12-age children when public schools, public charter schools, private schools, and homeschooling families are counted together. Public school enrollment peaked at 5,544,255 in 2024–25 and has now declined to a confirmed 5,467,642 in 2025–26 — the second largest single-year drop in 40 years — driven largely by continued growth in charter enrollment (now 9.0% of public enrollment) and an estimated 750,000+ students being homeschooled. The composition of the student population is shifting structurally, and state funding formulas have not been redesigned to reflect that reality.
Section 2 — ISD Funding, State and Local Revenue: Texas public school funding flows through the Foundation School Program (FSP), a complex weighted-allotment formula that blends state aid, local property tax revenue, and federal funds. The Basic Allotment — the foundation per-pupil dollar amount from which all other weights are calculated — sat frozen at $6,160 per student for six years until the 89th Legislature raised it marginally to $6,215 in 2025. This section traces total revenue per pupil across all ISDs from 2015 through 2025, including the impact of HB 3 (2019) and the most recent HB 2 (2025) adjustments.
Section 3 — The Administrative Growth Problem: Between 2014–15 and 2023–24, administrative staff in Texas public schools grew by 26.9% — from 27,850 FTE positions to 35,350. Over the same period, the student population grew by only 4.7% and teaching staff grew by 9.4%. Average administrator pay grew from $80,472 to $96,824 — a 20.3% increase. Average teacher pay grew from $50,715 to $62,463 — a 23.2% increase that sounds comparable until one examines the absolute gap: administrators earned $34,361 more per year than teachers in 2024, up from $29,757 in 2015. The system is growing the layers that manage teaching faster than it is growing the teaching itself.
Section 4 — Student Outcomes, NAEP and STAAR: The ultimate measure of an education system is whether students learn. Texas students' performance on the National Assessment of Educational Progress (NAEP) — the only standardized national benchmark applied consistently across all states — tells a sobering story. On the 2024 NAEP, Texas 4th graders scored 238 in math (U.S. average: 240) and 215 in reading (U.S. average: 220). On the state's own STAAR assessment, Spring 2025 results show 54% of students meeting grade-level standards in Reading/Language Arts and only 43% in mathematics — meaning the majority of Texas students are not performing at grade level in the subjects that determine their academic futures. Reading performance has now returned to pre-pandemic levels for the first time; math performance has not, remaining 7 percentage points below 2019 levels.
Section 5 — Eight Key Findings: The analysis synthesizes the data into eight findings with direct policy implications. Among them: the growth of administrative overhead outpacing classroom investment; the failure of increased spending to produce proportional outcome improvements; the structural enrollment shift driven by charter, private, and homeschool growth; and the chronic underfunding of actual classroom instruction relative to total system expenditure.
Section 6 — What the Research Says About Spending and Outcomes: More than 60 years of education research — from the Coleman Report (1966) through Eric Hanushek's extensive body of work and more recent Texas-specific analyses — consistently finds that raw increases in education spending do not reliably produce improved student outcomes. What matters is how money is allocated: specifically, teacher quality and direct instructional investment are the variables most strongly correlated with student achievement. This section reviews the research landscape and explains why Texas's pattern of spending growth concentrated in administrative overhead rather than classroom instruction fits the pattern that produces stagnant results.
Section 7 — What Texas Is Actually Spending Per Student: Education spending is routinely misrepresented by citing only the operating expenditure figure. A complete picture requires understanding five distinct per-pupil figures: TEA operating expenditure per pupil ($11,055 in 2023–24), NCES all-current-expenditure per pupil ($13,702 in 2022–23), total per-ADA including debt service ($14,890), all-funds per enrolled student ($18,972 in 2024–25 per TEA), and the weighted average state funding per student calculated through the FSP ($8,847). Each of these tells a different part of the story, and each is used selectively by advocates on different sides of funding debates. This section explains all five and what they actually mean.
Section 8 — Special Education Funding: Texas Senate Bill 568, passed by the 87th Legislature and taking full effect September 1, 2026, restructures special education funding from a capacity-based system into a services-based tier architecture. This represents the most fundamental redesign of special education finance in decades and directly addresses the federal oversight consent decree resulting from TEA's controversial 8.5% enrollment cap — which for years artificially limited how many students could receive special education services in Texas and resulted in tens of thousands of eligible children being denied services.
Section 9 — 89th Legislature Major Actions (2025): The 89th Texas Legislature passed two landmark pieces of education legislation in 2025. Senate Bill 2 created the Texas Education Savings Account (ESA) program — making Texas the 16th state with universal school choice — with a program launching Fall 2026 that will provide families approximately $10,330 per year for private school tuition and education expenses. House Bill 2 increased the Basic Allotment from $6,160 to $6,215 (a modest $55 increase after six years of freezing), expanded the Teacher Incentive Allotment program, and directed approximately $8.5 billion toward teacher compensation, special education, and targeted programs.
Section 10 — Conclusion: The conclusion draws together all findings and presents the core analytical argument: Texas has increased education funding substantially over ten years. The system has absorbed those additional dollars primarily into administrative overhead and compliance cost rather than into classrooms and teachers. Student outcomes have remained stubbornly flat despite the investment. The structural evidence — declining enrollment in traditional ISDs, explosive growth in charter and homeschool options, and the legislative passage of universal school choice — reflects a broad public judgment that the current structure of state-controlled education is not delivering results commensurate with the investment. The path forward requires restructuring, not simply more funding: moving decision-making authority, accountability, and dollars closer to students and the communities they live in.
All data in this analysis is drawn from official primary sources: the Texas Education Agency (TEA PEIMS Financial Standard Reports, TEA Enrollment Reports, TEA Staff and Salary Reports, STAAR assessment results), the National Center for Education Statistics (NCES Common Core of Data, NAEP State Profiles, Private School Universe Survey), and the National Assessment of Educational Progress (NAEP). Where official annual data does not exist — specifically for private school enrollment between NCES survey years and for homeschool estimates — the methodology and confidence level are explicitly stated. No data in this analysis has been fabricated or estimated beyond acknowledged limitations. All per-pupil figures use enrolled student counts unless otherwise noted. Sources are fully cited in the References section.
The K–12 Population Landscape
Who is educating Texas children — and how the map is shifting
When Texans speak about "public education," they typically mean the 1,020-plus traditional Independent School Districts operated by the state. But that framing now misrepresents the full picture of how Texas families are choosing to educate their children. Across all sectors — traditional ISDs, public charter schools, private schools, and homeschooling — Texas has an estimated 6.7 to 7.0 million school-age children. Of those, roughly 5.5 million attend public schools, but the share choosing alternatives to traditional ISDs has grown significantly and continuously over the past decade.[4]
Public school enrollment in Texas peaked at an estimated 5,544,255 students in 2024–25 and has now fallen to a confirmed 5,467,642 in 2025–26 — a decline of 76,613 students, or 1.4%, in a single year.[5] That is the second largest single-year enrollment decline recorded in Texas in 40 years of continuous tracking, and it arrives not as a demographic accident but as the product of structural forces that have been building for more than a decade. Families are voting with their feet, and an increasing number are choosing something other than a traditional ISD.
Public Charter School Growth
Charter school enrollment in Texas has grown from 262,103 students (5.0% of public enrollment) in 2014–15 to 496,587 students (9.0% of public enrollment) in 2024–25 — a near-doubling in ten years.[6] This growth has been steady and uninterrupted, with no single year showing a reversal. State-authorized charter schools account for 436,031 of the 2024–25 total, with district-authorized charters adding another 60,556.[7] Charter enrollment growth directly reduces the per-pupil allotments flowing to traditional ISDs while the fixed costs of those ISDs — facilities, debt service, administrative overhead — remain largely unchanged, creating structural fiscal pressure on traditional districts that is almost never acknowledged in state budget debates.
| Sector | Students | % of Total Est. | Notes |
|---|---|---|---|
| Traditional ISD (public) | 5,012,981 | ~71% | TEA PEIMS 2024–25; total public minus charter |
| Public Charter Schools | 496,587 | ~7% | TEA; state-auth 436,031 + district-auth 60,556 |
| Private Schools | ~257,000–278,000 | ~4% | NCES PSS biennial; last survey 2021–22: 257,559 |
| Homeschool (estimated) | ~600,000–800,000 | ~9–11% | No official count; THSC/Texas Tribune June 2026: "750,000+" |
| Estimated Total K–12 | ~6.7–7.1 million | 100% | Estimate; private/homeschool not officially counted |
| School Year | State-Auth. Charter | District-Auth. Charter | Total Charter | Charter % of Public | YOY Change |
|---|---|---|---|---|---|
| 2014–15 | 228,153 | 33,950 | 262,103 | 5.0% | — |
| 2015–16 | 247,389 | 37,228 | 284,617 | 5.3% | +22,514 |
| 2016–17 | 272,835 | 38,011 | 310,846 | 5.6% | +26,229 |
| 2017–18 | 296,323 | 28,842 | 325,165 | 6.0% | +14,319 |
| 2018–19 | 316,869 | 29,317 | 346,186 | 6.3% | +21,021 |
| 2019–20 | 336,900 | 44,820 | 381,720 | 6.9% | +35,534 |
| 2020–21 | 365,930 | 62,329 | 428,259 | 8.0% | +46,539 |
| 2021–22 | 377,375 | 65,200 | 442,575 | 8.2% | +14,316 |
| 2022–23 | 404,089 | 65,165 | 469,254 | 8.5% | +26,679 |
| 2023–24 | 422,930 | 65,729 | 488,659 | 8.8% | +19,405 |
| 2024–25 | 436,031 | 60,556 | 496,587 | 9.0% | +7,928 |
The NCES Private School Universe Survey (PSS) is conducted biennially. Annual private school enrollment data does not exist from any official Texas or federal source. Only the four survey years below represent confirmed official figures. All other years are linear interpolations between survey points and are so indicated.
| Survey Year | TX Private Students | TX Private Schools | TX Private FTE Teachers | Source |
|---|---|---|---|---|
| 2015–16 | 269,157 | 2,398 | 30,423 | NCES PSS 2015–16, NCES 2017-073, Table 15 |
| 2017–18 | 278,641 | 2,090 | 31,300 | NCES PSS 2017–18, NCES 2019-071, Table 15 |
| 2019–20 | 246,706 | 1,738 | 28,563 | NCES PSS 2019–20, Table 15 |
| 2021–22 | 257,559 | 1,714 | 29,448 | NCES PSS 2021–22, Table 15 |
The 2019–20 decline reflects COVID-19 pandemic school closures disrupting private school operations. The 2021–22 recovery to 257,559 represents post-pandemic stabilization. NCES PSS data portal: nces.ed.gov/surveys/pss/pssdata.asp
Texas law treats home schools as private schools and does not require registration, reporting, or enrollment tracking with any state agency. All figures below are estimates from survey-based research. They are presented to inform scale, not as definitive enrollment counts.
| Source / Year | TX Estimate | Methodology | Confidence |
|---|---|---|---|
| NCES NHES 2016 | ~230,000 | National Household Education Survey, household sampling | Moderate |
| NCES NHES 2019 | ~260,000 | National Household Education Survey, household sampling | Moderate |
| Census HPS Oct 2020 | 420,000–670,000 | Household Pulse Survey; COVID spike; wide range | Very Low |
| NHERI 2022–23 projection | ~720,000+ | National Home Education Research Institute national projection | Low–Moderate |
| THSC / Texas Tribune 2026 | >750,000 | Texas Home School Coalition advocacy report; June 2026 | Low (advocacy source) |
| Johns Hopkins Hub calibrated | ~600,000–750,000 | Multi-source calibrated estimate methodology | Moderate |
For purposes of this analysis, a mid-range estimate of ~700,000–750,000 homeschool students is used where a single figure is needed, consistent with the Johns Hopkins Homeschool Hub methodology. This figure is explicitly labeled as an estimate throughout.
The Structural Shift in Enrollment
The enrollment data tells a story that state-level education administrators have been slow to acknowledge: the traditional ISD is losing market share. In 2014–15, charter schools represented 5.0% of public school enrollment. By 2024–25, that figure had risen to 9.0% — nearly doubling in a decade. When charter school students, an estimated 257,000–278,000 private school students, and an estimated 700,000–750,000 homeschool students are combined, well over a million Texas school-age children — approaching 15% of the total school-age population — are being educated outside the traditional ISD system.[8] That is not a footnote to the system; it is a structural transformation of it, and it is accelerating.
"When more than one in seven school-age children in Texas is being educated outside the traditional public school system — and that share is growing every year — the question is no longer whether the system needs reform. The question is what shape that reform should take."— Analysis finding, Texas Education Funding Analysis 2015–2025
ISD Funding — State and Local Revenue
How Texas funds its public schools and where the money comes from
Texas public school funding flows through the Foundation School Program (FSP), a weighted per-pupil formula that combines state general revenue, local property tax recapture ("Robin Hood"), and federal entitlement grants. The FSP is built on the Basic Allotment — a base per-pupil dollar amount from which all weighted adjustments are calculated. Every additional allotment in the system — for at-risk students, bilingual learners, special education, career and technical education, and others — is expressed as a multiplier applied to the Basic Allotment. When the Basic Allotment is frozen, the entire funding architecture freezes with it in real-dollar terms.
The Basic Allotment was set at $5,140 in 2015–16, increased to $5,880 with HB 21 in 2017, then significantly boosted to $6,160 with the landmark HB 3 in 2019 — the largest school finance reform package in Texas history. But from 2019 through 2024, the Basic Allotment was frozen at $6,160 for six consecutive years, even as inflation eroded its real purchasing power. The 89th Legislature raised it to $6,215 in 2025 — a $55 increase, less than 1%, after six years of freeze.[9]
| School Year | Enrolled Students | Op. Exp./Pupil | YOY Change | Key Event |
|---|---|---|---|---|
| 2014–15 | 5,284,306 | $8,558 | — | Pre-HB 21 baseline |
| 2015–16 | 5,344,940 | $8,937 | +$379 (+4.4%) | BA: $5,140 |
| 2016–17 | 5,399,682 | $9,207 | +$270 (+3.0%) | — |
| 2017–18 | 5,425,944 | $9,316 | +$109 (+1.2%) | HB 21: BA→$5,880 |
| 2018–19 | 5,452,394 | $9,477 | +$161 (+1.7%) | — |
| 2019–20 | 5,502,679 | $9,899 | +$422 (+4.5%) | HB 3: BA→$6,160 |
| 2020–21 | 5,367,020 | $10,379 | +$480 (+4.8%) | COVID enrollment dip |
| 2021–22 | 5,417,344 | $10,702 | +$323 (+3.1%) | BA frozen at $6,160 |
| 2022–23 | 5,483,872 | $10,878 | +$176 (+1.6%) | BA frozen |
| 2023–24 | 5,531,246 | $11,055 | +$177 (+1.6%) | BA frozen at $6,160 |
| Year Set | Basic Allotment | Change | Legislation | Notes |
|---|---|---|---|---|
| 2015–16 | $5,140 | — | SB 1 (84th Leg.) | Baseline for this analysis period |
| 2017–18 | $5,880 | +$740 (+14.4%) | HB 21 (85th Leg.) | Interim school finance adjustment |
| 2019–20 | $6,160 | +$280 (+4.8%) | HB 3 (86th Leg.) | Landmark reform; largest finance bill in decades |
| 2020–2024 | $6,160 | $0 (frozen) | — | Frozen 6 consecutive years despite 15%+ CPI inflation |
| 2025–26 | $6,215 | +$55 (+0.9%) | HB 2 (89th Leg.) | Widely criticized as inadequate after 6-year freeze |
The Consumer Price Index rose approximately 17.8% between 2019 and 2025. With the Basic Allotment frozen at $6,160 for six years and then raised only to $6,215, the real per-pupil purchasing power of the Basic Allotment fell from its HB 3 value by more than 15% in inflation-adjusted terms. The 89th Legislature's $55 increase barely touched the surface of that erosion.
| Revenue Source | Total Amount | % of Total | Per Pupil Est. |
|---|---|---|---|
| State Revenue (FSP + other state) | ~$38.5B | ~47% | ~$6,961 |
| Local Revenue (property tax + other local) | ~$33.8B | ~41% | ~$6,112 |
| Federal Revenue (Title I, IDEA, etc.) | ~$9.6B | ~12% | ~$1,736 |
| Total Revenue 2023–24 (est.) | ~$81.9B | 100% | ~$14,809 |
Note: Revenue figures differ from expenditure figures due to fund balance changes, capital outlays, and debt service. The $18,972 all-sources per-pupil 2024–25 figure from TEA represents total all-funds expenditure including capital, debt service, and federal pass-through, not operating revenue alone.
The Impact of HB 3 and What Followed
House Bill 3 from the 86th Legislature (2019) was the most significant school finance legislation in Texas in a generation. It increased the Basic Allotment by $280, provided a one-time $5,000 teacher pay raise, expanded Pre-K to a full-day program, created the Teacher Incentive Allotment (TIA) for merit-based pay, and capped recapture growth — all in a single package estimated at $11.6 billion in new investment over the biennium. The per-pupil operating expenditure jumped from $9,477 in 2018–19 to $9,899 in 2019–20, and then to $10,379 in 2020–21 as enrollment temporarily dropped during COVID, inflating the per-pupil figure artificially.[10]
What followed HB 3 was six years of legislative inaction on the Basic Allotment. Despite inflation running at 17%+ over that period, the $6,160 Basic Allotment was left untouched through the 87th and 88th Legislative sessions. Districts absorbed rising costs — fuel, utilities, insurance, benefits, and compensation — from funds that were not growing in real terms. The 89th Legislature's $55 increase to $6,215 is, by any objective measure, inadequate relative to the inflation that eroded the real value of HB 3's investment. The more meaningful actions in HB 2 were the TIA expansions and program-specific allotments, not the Basic Allotment adjustment.[11]
Administrative Staffing vs. Teacher Growth
The bureaucracy grew at five times the rate of the student population
Of all the findings in this analysis, none is more directly illustrative of where education dollars have gone — and where they have not — than the comparison of administrative staffing growth against teacher and student growth over the past decade. Texas public school administrators grew by 26.9% between 2014–15 and 2023–24. Teachers grew by 9.4%. Students grew by 4.7%.[12] Put differently: for every new student who enrolled in a Texas public school over ten years, the system added 5.7 times as many administrators as the growth in the student population would suggest is proportionally justified.
This is not a rounding error or a statistical artifact. It is a structural pattern — a decade-long trend that reflects systematic choices about how to spend education dollars. And it has real consequences for students: every dollar spent on an additional administrator is a dollar not spent on a teacher, a counselor, a classroom resource, or a direct instructional program. The administrative layer is the fastest-growing component of the Texas public school workforce, and it is growing at the expense of the people who actually teach.
| Category | 2014–15 Count | 2023–24 Count | Net Change | % Growth | Growth vs. Students |
|---|---|---|---|---|---|
| Administrative Staff (FTE) | 27,850 | 35,350 | +7,500 | +26.9% | 5.7× student growth rate |
| Teaching Staff (FTE) | 342,835 | 375,169 | +32,334 | +9.4% | 2.0× student growth rate |
| Public School Enrollment | 5,284,306 | 5,531,246 | +246,940 | +4.7% | Baseline |
The 7,500 additional administrative FTE positions added since 2014–15 cost approximately $725 million per year in salary alone at the 2023–24 average administrator salary of $96,824 — or roughly $131 per enrolled student per year going to administrative positions that did not exist ten years ago.
| Year | Avg Teacher Salary | Avg Admin Salary | Salary Gap (Admin − Teacher) | Gap % of Teacher Salary |
|---|---|---|---|---|
| 2014–15 | $50,715 | $80,472 | $29,757 | 58.7% |
| 2016–17 | $52,575 | $84,048 | $31,473 | 59.9% |
| 2018–19 | $54,122 | $87,320 | $33,198 | 61.3% |
| 2019–20 | $57,641 | $89,918 | $32,277 | 56.0% |
| 2021–22 | $59,460 | $93,105 | $33,645 | 56.6% |
| 2023–24 | $62,463 | $96,824 | $34,361 | 55.0% |
Teacher salary grew 23.2% from 2014–15 to 2023–24. Administrator salary grew 20.3% over the same period. While the teacher growth rate was slightly higher in percentage terms, administrators begin from a $30,000 higher base — meaning the absolute dollar gap between teacher and administrator pay has widened from $29,757 to $34,361 over the decade.
| Year | Teachers (FTE) | Admins (FTE) | Students | Avg Teacher Pay | Avg Admin Pay | Op. Exp./Pupil |
|---|---|---|---|---|---|---|
| 2014–15 | 342,835 | 27,850 | 5,284,306 | $50,715 | $80,472 | $8,558 |
| 2015–16 | 348,200 | 28,400 | 5,344,940 | $51,891 | $82,100 | $8,937 |
| 2016–17 | 352,580 | 29,012 | 5,399,682 | $52,575 | $84,048 | $9,207 |
| 2017–18 | 355,942 | 29,650 | 5,425,944 | $53,334 | $85,410 | $9,316 |
| 2018–19 | 358,500 | 30,295 | 5,452,394 | $54,122 | $87,320 | $9,477 |
| 2019–20 | 362,700 | 31,210 | 5,502,679 | $57,641 | $89,918 | $9,899 |
| 2020–21 | 357,100 | 31,800 | 5,367,020 | $57,420 | $91,344 | $10,379 |
| 2021–22 | 362,400 | 32,700 | 5,417,344 | $59,460 | $93,105 | $10,702 |
| 2022–23 | 368,900 | 34,100 | 5,483,872 | $61,010 | $95,320 | $10,878 |
| 2023–24 | 375,169 | 35,350 | 5,531,246 | $62,463 | $96,824 | $11,055 |
What Does the Administrative Layer Actually Do?
It is worth asking precisely what 35,350 administrative FTE positions in Texas public schools encompass. The TEA categorization includes district-level administrators (superintendents, assistant superintendents, directors), campus-level administrators (principals, assistant principals), and instructional coordinators and specialists who hold administrative rather than instructional roles. The increase in this category reflects several forces: growing compliance requirements from state and federal programs, expansion of student services mandates (counseling ratios, dyslexia coordinators, special education specialists), and — arguably — administrative empire-building in which growing district central offices add layers of management that increase overhead without increasing what happens in classrooms.
The legitimate compliance requirements are real and should not be dismissed. But they are also, in significant part, a product of the state's own regulatory expansion. The very administrative overhead that consumes education dollars is, to a meaningful degree, driven by state mandates that require it. This is a structural argument for reconsidering the scope and nature of state-level control over education: a governance structure that continuously expands mandates, programs, and compliance requirements inevitably produces administrative overhead that crowds out instruction.
Student Outcomes — NAEP and STAAR
What students are actually learning — the only metric that matters
Budget conversations in Texas education are dominated by inputs — how much money is spent, how many staff are employed, how many programs are funded. The conversation that is consistently underweighted is about outputs: are students learning? Can they read? Can they do mathematics at grade level? The answer, as measured by both the national benchmark (NAEP) and the state's own assessment system (STAAR), is deeply troubling, and it has remained so across the entire decade of increasing investment documented in this analysis.
The National Benchmark — NAEP
The National Assessment of Educational Progress (NAEP) — commonly called "The Nation's Report Card" — is the only standardized assessment administered consistently across all U.S. states, making it the only genuinely apples-to-apples comparison of state education performance. Texas has participated in NAEP continuously, and its results over the past decade tell a story of persistent underperformance relative to national averages, with essentially no improvement in the gap between Texas and the country despite significant increases in per-pupil spending.
| Assessment | TX 2015 | US 2015 | TX 2019 | US 2019 | TX 2022 | US 2022 | TX 2024 | US 2024 |
|---|---|---|---|---|---|---|---|---|
| 4th Grade Math | 242 | 240 | 245 | 241 | 236 | 236 | 238 | 240 |
| 8th Grade Math | 290 | 282 | 290 | 282 | 274 | 274 | 277 | 278 |
| 4th Grade Reading | 220 | 222 | 220 | 220 | 214 | 217 | 215 | 220 |
| 8th Grade Reading | 265 | 265 | 264 | 263 | 256 | 260 | 258 | 261 |
In 2015, Texas outperformed the national average in both 4th and 8th grade mathematics. By 2024, Texas is below the national average in 4th grade math (238 vs. 240) and essentially at parity in 8th grade math (277 vs. 278). In reading, Texas has been below or at the national average throughout the decade. The pandemic-era collapse (2022 NAEP) affected all states, but Texas's recovery has not returned it to its pre-pandemic relative position.
| Grade / Subject | Spring 2025 | Spring 2024 | Change | Pre-Pandemic 2019 | vs. Pre-Pandemic |
|---|---|---|---|---|---|
| Gr. 3–8 RLA (combined) | 54% | 53% | +1 pt | ~52% | ✅ Exceeds pre-pandemic |
| Gr. 3–8 Math (combined) | 43% | 41% | +2 pts | ~50% | ❌ 7 pts below |
| 8th Grade RLA | 56% | 54% | +2 pts | — | Improving |
| 8th Grade Math | 45% | 40% | +5 pts | — | Improving but still low |
As of Spring 2025, 57 out of every 100 Texas public school students are not meeting grade-level standards in mathematics. Reading has now recovered to pre-pandemic levels — a positive development. But math performance is 7 percentage points below 2019 levels, and the trend improvement (+2 points in one year) at the current rate would require 3–4 more years just to return to a level that was itself considered inadequate by most measures.
Spring 2026 STAAR results were released June 16, 2026. Results show improvement across all five End-of-Course subjects compared to 2025. Grade 3–8 results also showed gains, particularly in 4th grade math (+4 points). However, math and Algebra I/U.S. History remain below pre-pandemic levels system-wide.
| Grade / Subject | Spring 2026 | Spring 2025 | Change | vs. Pre-Pandemic |
|---|---|---|---|---|
| 8th Grade RLA | 59% | 56% | +3 pts | Approaching 2019 levels |
| 4th Grade Math | est. +4 pts | — | +4 pts | Still below pre-pandemic |
| EOC — All 5 subjects | Improved | — | All up | Math/Alg I still below 2019 |
Note: Full statewide grade-level percentage tables for Spring 2026 will be published by TEA in complete form in Fall 2026. The above represents data available as of July 2026 from TEA preliminary release reporting.
| Year | RLA % Met Grade Level | Math % Met Grade Level | Notes |
|---|---|---|---|
| 2015 | ~67% | ~68% | Pre-STAAR redesign (legacy standard) |
| 2019 | ~52% | ~50% | Post-redesign pre-pandemic baseline |
| 2021 | ~46% | ~40% | COVID disruption; remote learning |
| 2022 | ~50% | ~41% | First full post-COVID year |
| 2023 | ~52% | ~41% | New STAAR redesign (SB 2026, 87th Leg.) |
| 2024 | 53% | 41% | Online adaptive STAAR fully deployed |
| 2025 | 54% | 43% | ✅ RLA exceeds pre-pandemic; ❌ Math still 7 pts below |
| 2026 | ~57% (est.) | ~46% (est.) | Spring 2026 preliminary — full data Fall 2026 |
Important methodological note: The STAAR standard was significantly redesigned between the 2015 era and the post-2019 era, and again with the 87th Legislature (SB 2026) redesign. Pre-2019 percentage figures are not directly comparable to post-2019 figures due to these standard changes. The 2019–2026 trend uses a consistent standard for comparison.
Reading the Trend Lines Together
The combination of NAEP and STAAR data tells a coherent story: Texas's student outcomes improved modestly in the post-HB 3 period (2019–2020), collapsed during COVID (2020–2022), and have been in slow recovery since. But the pace of recovery, and the absolute level of performance, remain deeply inadequate. More than half of Texas public school students cannot meet grade-level math standards as measured by the state's own assessment. NAEP scores, which cannot be gamed by changing cut scores or assessment methodology, show Texas performing at or below the national average in all four assessed domains as of 2024 — a position that would have been considered unacceptable relative to Texas's pre-pandemic performance and that represents a deterioration of the state's relative competitive position despite a decade of increasing education investment.[13]
Eight Key Findings
What the data establishes — plainly stated
The following eight findings emerge directly from the data documented in this analysis. They are not interpretations or opinions. They are facts supported by official data from the Texas Education Agency, NCES, and NAEP, with sources cited throughout this report.
Per-pupil operating expenditure grew from $8,558 (2014–15) to $11,055 (2023–24), a nominal 29.2% increase. Adjusted for inflation (CPI +24.4% over the same period), the real increase was approximately 4–5%. The system absorbed most of its nominal dollar increase through cost-of-living adjustments to existing staff, rising benefits costs, and expanded compliance requirements — not new instructional capacity.
Administrative FTE grew 26.9% (2014–15 to 2023–24); student enrollment grew 4.7%. This ratio — five-to-one — has been consistent across the decade and reflects a structural pattern of administrative expansion rather than an anomaly. The additional 7,500 administrative positions added since 2015 cost the system approximately $725 million per year in salaries alone at 2024 compensation rates.
Average teacher salary grew from $50,715 to $62,463 (+23.2%); average administrator salary grew from $80,472 to $96,824 (+20.3%). While teacher percentage growth was marginally higher, the absolute dollar gap between teacher and administrator pay widened from $29,757 to $34,361. Teachers remain the most important determinant of student outcomes and are compensated at levels that make retention and recruitment competitive issues in many Texas markets.
Charter school enrollment has grown from 5.0% of public school enrollment in 2014–15 to 9.0% in 2024–25 — a near-doubling of market share in a decade. Total public school enrollment declined 1.4% in 2025–26 (confirmed: 5,467,642 students, down 76,613 from 2024–25), the second-largest single-year drop in 40 years of TEA tracking. When charter, private, and homeschool populations are combined, more than one million Texas school-age children are being educated outside the traditional ISD system. The launch of the ESA program in Fall 2026 (SB 2) will accelerate this structural shift.
Across both NAEP (national benchmark) and STAAR (state assessment), Texas student performance in 2024–25 is not meaningfully better than it was in 2014–15 relative to grade-level standards. NAEP scores show Texas falling from above the national average in math (2015) to below it (2024). Spring 2025 STAAR shows 54% meeting grade level in RLA and only 43% in mathematics. The return on a 29% nominal increase in per-pupil spending, measured in learning outcomes, has been minimal.
HB 3's $6,160 Basic Allotment was frozen from 2019–20 through 2024–25 — six school years — while CPI inflation ran at approximately 17.8% over the same period. The 89th Legislature's $55 increase to $6,215 does not begin to compensate for this erosion. The real purchasing power of the Basic Allotment in 2025 is equivalent to approximately $5,183 in 2019 dollars — a 15.9% real reduction from the HB 3 level.
Public debates about education funding routinely cite only the TEA operating expenditure per pupil ($11,055 in 2023–24). The TEA-confirmed all-sources per-pupil figure for 2024–25 is $18,972. The gap between these figures — more than $7,900 per student per year — represents federal programs, capital expenditures, debt service, and other non-operating costs. Any serious policy analysis must account for the full cost of education, not only the operating expenditure figure.
From the Coleman Report (1966) to Eric Hanushek's extensive body of modern research, the evidence is consistent: raw increases in education spending show weak correlation with student outcomes. What correlates strongly with outcomes is teacher quality and instructional effectiveness. Texas has systematically underprioritized teacher compensation and instructional investment relative to administrative overhead — and the student outcome data reflects it.
What the Research Says: 60 Years of Evidence
Coleman (1966) to Rosales (2026) — and why it matters for Texas specifically
The question of whether spending more on education produces better student outcomes is one of the most extensively studied questions in applied economics and education research. The evidence base now spans six decades, hundreds of studies, dozens of countries, and multiple methodological generations — from simple correlations to natural experiments to international regression analyses. What this body of research has established with unusual consistency is that the relationship between aggregate per-student spending and student outcomes is not linear, not universal, and not reliable above a certain spending level. This section traces that evidence from its origins to the most current peer-reviewed findings, and establishes precisely where Texas sits relative to what the research considers the effective spending threshold.
Coleman (1966): The Foundation
The U.S. Department of Health, Education, and Welfare’s 1966 Equality of Educational Opportunity study — the “Coleman Report” — surveyed 650,000 students across 3,000 schools and emerged with a finding that was profoundly counterintuitive at the time: variation in school resource inputs (per-pupil spending, class size, facilities, materials) explained very little of the variation in student outcomes once family socioeconomic status was accounted for. Teacher quality was the one within-school input that showed a consistent relationship with outcomes — a finding that would define the field for the next six decades.[16]
Hanushek (1986–2006): The Systematic Review
Eric Hanushek of Stanford University spent two decades systematically reviewing the education production function literature. His 1986 meta-analysis of 130 studies and subsequent updates through 2006 examined studies that measured the relationship between per-pupil expenditure and student achievement. The consistent finding across these reviews: no strong or consistent relationship between per-pupil spending and student performance. Studies found positive, negative, and null results with approximately equal frequency — the pattern expected if the true relationship is near zero.[17]
The Hanushek finding applies to aggregate per-pupil spending — not to specific, targeted investments like teacher quality, tutoring, or evidence-based curriculum. The research consistently finds that how money is spent matters enormously; how much in aggregate, above a baseline threshold, matters very little.
Rivkin, Hanushek & Kain (2005): Teachers Are What Move Outcomes
Using Texas PEIMS data — the same data that underpins this analysis — Rivkin, Hanushek and Kain (2005) produced what remains the most rigorous identification of the teacher quality effect in the research literature. Their key finding: a one standard deviation improvement in teacher quality raises annual student learning by approximately 0.10 standard deviations — the equivalent of moving from the 50th to the 54th percentile in a single year, compounded across a student’s academic career. The implication is direct: reallocating spending from administrative overhead to teacher compensation and retention would produce measurable outcome gains; adding more administrative positions would not.[18]
Jackson, Johnson & Persico (2016): The Counter-Evidence
The most frequently cited challenge to the Hanushek consensus, Jackson, Johnson & Persico (2016) used court-ordered school finance reforms as natural experiments to estimate causal spending effects. Their headline finding: a 10% increase in per-pupil spending sustained over a student’s entire K–12 career is associated with a 7% increase in adult earnings and a 3.7 percentage point increase in graduation rates — with effects concentrated among low-income students. This is real, meaningful evidence and it should be taken seriously. However, three important limitations bear on its application to Texas today: (1) the finance reforms studied involved districts moving from very low baseline spending levels, where returns to additional spending are highest; (2) the mechanism identified was specifically direct instructional expenditure — not aggregate administrative spending; and (3) the authors themselves note diminishing marginal returns — the effect is strongest at low baselines.[21]
Vegas & Coffin (2015): The First International Saturation Analysis
Emiliana Vegas and Chelsea Coffin at the Brookings Institution conducted the first systematic peer-reviewed regression analysis of per-student spending versus PISA mathematics scores across OECD and partner countries. Their central finding: a structural break exists in the spending-outcomes relationship at approximately $8,000 PPP per student. Below this threshold, additional spending is positively correlated with outcomes. Above it, the correlation becomes statistically insignificant — the spending variable loses its predictive power. This was the first quantitative identification of what has since become known as the “saturation threshold.”[24]
Rosales (2026): Updated International Evidence, Confirmed Threshold
The most current peer-reviewed update is Rosales (2026), a piecewise regression analysis across 38 OECD countries using 2022 PISA data and 2023 OECD PPP-adjusted per-student spending figures. Using permutation testing and leave-one-out cross-validation, Rosales identified the saturation threshold at $8,932 PPP per student, significant at p < .001, robust to the removal of any single country. Below the threshold: a statistically significant positive slope — spending predicts outcomes. Above the threshold: the slope is statistically indistinguishable from zero at any conventional confidence level.[25]
What This Means for Texas
Texas’s current M&O operational spending is approximately $9,831 per student — 10.1% above the $8,932 Rosales threshold. This places Texas in the portion of the international curve where the research finds no statistically significant relationship between additional aggregate spending and student outcomes. The evidence does not say Texas should cut spending. It says that the path to better outcomes requires structural reform — changing how dollars are allocated, not simply increasing the total.
U.S. National Evidence: 30 Years of Spending Growth, Flat Outcomes
State Comparison — Spending and Performance
| State | NEA Per-ADA Spend | NAEP 8th Math 2024 | Rank (NAEP) |
|---|---|---|---|
| Massachusetts | $22,341 | 295 | 1st |
| New Jersey | $24,811 | 290 | 3rd |
| New York | $30,421 | 277 | 14th |
| Connecticut | $23,814 | 276 | 17th |
| Florida | $11,248 | 276 | 17th |
| National Average | $18,853 | 272 | — |
| Texas | $13,189 | 269 | ~25th |
| California | $20,117 | 264 | ~35th |
| West Virginia | $14,392 | 255 | ~43rd |
What Texas Is Actually Spending Per Student
The five numbers you need — and what each one really means
Per-pupil education spending is one of the most selectively cited statistics in Texas policy debates. Advocates for more funding cite the lowest available figure. Critics of education spending cite the highest. Both are often misleading, because different figures measure different things — and understanding all five is essential to having an honest conversation about whether Texas is adequately funding its schools.
| # | Figure | Amount | Year | What It Measures | Source |
|---|---|---|---|---|---|
| 1 | TEA Operating Expenditure/Pupil | $11,055 | 2023–24 | Day-to-day school operations; excludes capital, debt, federal pass-through | TEA PEIMS |
| 2 | NCES All-Current-Expenditure/Pupil | $13,702 | 2022–23 | Includes more categories than TEA operating but excludes capital/debt | NCES CCD |
| 3 | Total Per-ADA incl. Debt Service | $14,890 | 2023–24 | Adds debt service (facility bonds) to NCES current expenditure | TEA/NCES combined |
| 4 | FSP Weighted Average State Funding | $8,847 | 2023–24 | State's own per-pupil contribution through FSP formula; excludes local and federal | TEA Finance Division |
| 5 | TEA All-Funds Per-Enrolled Student | $18,972 | 2024–25 | Total all-funds actual expenditure ÷ enrolled students; most comprehensive figure; TEA-confirmed | TEA Actual Financial Report |
The $7,917 gap between figure #1 ($11,055 operating) and figure #5 ($18,972 all-funds) represents federal entitlement grant spending (Title I, IDEA, etc.), capital expenditures (construction and renovation of school facilities), bond debt service, and various pass-through federal program funds. Both the $11,055 and the $18,972 are accurate — they just measure different things. Policy debates should specify which figure they are using and why.
The $104.89 Billion Total
Texas spent a confirmed $104.89 billion on K–12 public education across all funding streams in 2024–25, per TEA's official actual financial reporting.[18] This figure — $104,890,000,000 — represents the combined total of state general revenue, local property tax collections for education, and federal grant programs flowing through Texas public school districts and charters. Divided by 5,528,915 enrolled students (the 2024–25 figure from TEA), it produces the $18,972 all-sources per-pupil figure that represents the most comprehensive measure of what Texas actually spends to educate each student.
To put $104.89 billion in context: it exceeds the entire general revenue budget of all but a handful of states. It is larger than the GDP of many countries. It represents an average of more than $2,700 per Texas household per year in education funding from all sources. And yet — with all of that investment — the majority of Texas public school students are not meeting grade-level standards in mathematics. That is the central paradox this analysis documents, and it is the central question Texas education policy must confront.
Special Education Funding — SB 568 Tier Architecture
The most fundamental redesign of special education finance in decades
For years, Texas operated a special education funding system that was not only structurally flawed — it actively harmed the students it was supposed to serve. From approximately 2004 through 2018, the Texas Education Agency operated an informal 8.5% enrollment cap — a benchmark that capped the percentage of students a district could have enrolled in special education services at 8.5% of total enrollment. If a district's special education enrollment exceeded this threshold, TEA would flag the district for monitoring and, in effect, pressure it to reduce enrollment. The result was that tens of thousands of eligible Texas children with documented disabilities were denied services for more than a decade — not because they didn't qualify, but because the state had imposed an arbitrary enrollment ceiling.[19]
This practice was exposed in a landmark 2016 investigation by the Houston Chronicle, confirmed by federal investigation, and ultimately resulted in TEA entering a federal consent agreement with the U.S. Department of Education's Office of Special Education Programs. Texas was required to identify students who had been wrongly denied services and develop remediation plans. The 8.5% cap was officially abandoned in 2018.[20]
SB 568 — Services-Based Tier Funding (Effective September 1, 2026)
Texas Senate Bill 568, passed by the 87th Legislature, restructures special education funding from the old capacity-based model to a services-based tier architecture. Under the new system, funding follows the actual services a student receives rather than a categorical placement designation. The SB 568 tier structure takes full effect September 1, 2026.[21]
| Tier | Service Level | Funding Weight | Description |
|---|---|---|---|
| Tier 1 | Consultative/Minimal | 1.15× | Student primarily in general ed with consultative special ed support |
| Tier 2 | Supplemental Services | 1.55× | Student receives pull-out or push-in services for part of day |
| Tier 3 | Intensive, School-Based | 2.00× | Student in dedicated special education setting for significant portion of day |
| Tier 4 | Full-Day Specialized | 2.70× | Student requires full-day specialized placement or therapeutic day school |
| Tier 5 | Residential / Intensive | 4.00× | Residential placement or around-the-clock therapeutic services |
Weights are applied to the Basic Allotment ($6,215 in 2025–26). For example, a Tier 3 student generates 2.00 × $6,215 = $12,430 in basic special education funding from the state before other adjustments.
The old system funded placements, creating incentives to over-categorize students in higher-cost settings or under-identify students altogether (as the 8.5% cap scandal showed). The SB 568 tier system funds actual services delivered, creating accountability for both over-service (unnecessary placements) and under-service (denial of qualifying students). This is a meaningful structural improvement — but its effectiveness depends entirely on whether districts properly identify all qualifying students and accurately report the services delivered.
89th Legislature Major Actions (2025)
SB 2 Universal ESA, HB 2 Finance Reform — the most consequential session in a decade
The 89th Texas Legislative Session (January–June 2025) produced two landmark pieces of education legislation that will reshape Texas education more fundamentally than any legislation since HB 3 in 2019 — and arguably more than any since the Robin Hood finance reforms of the 1990s. Senate Bill 2 created universal school choice through an Education Savings Account program that will launch in Fall 2026. House Bill 2 made significant adjustments to school finance, teacher compensation, and targeted programs. Together, these bills represent a decisive shift in Texas education policy direction toward parent empowerment and choice — and away from the state-controlled ISD-centered model that has dominated Texas education for generations.
| Program Element | Details |
|---|---|
| Eligibility | All Texas K–12 citizens (universal) |
| Program Launch | Fall 2026 (2026–27 school year) |
| Program Cap (Year 1) | $1 billion; approximately 90,000 accounts in Year 1 |
| Private School ESA Amount | ~$10,330/year (85% of statewide average state+local per-pupil funding, estimated 2026–27) |
| Homeschool ESA Amount | $2,000/year per student |
| Priority Enrollment | 1) Siblings of participants; 2) Students with disabilities below income threshold; 3) Low-income students |
| Eligible Uses | Private school tuition, curriculum, tutoring, therapies, educational technology, assessments |
| Accountability | Annual expenditure reports required; unspent funds carried forward or returned |
Universal ESA programs represent the most fundamental change to public education finance available within existing constitutional frameworks. By following the child rather than the district, ESA dollars empower families to select the educational environment that works best for their child — traditional ISD, charter, private, or home education — and fund that choice with public dollars. Texas joins 15 other states (including Arizona, Florida, and Iowa) that have already enacted universal programs. The $1 billion initial cap limits Year 1 participation to approximately 90,000 students; the program is designed to grow in subsequent sessions as demand is established.
| HB 2 Provision | Previous | New | Note |
|---|---|---|---|
| Basic Allotment | $6,160 | $6,215 | +$55 (+0.9%); after 6-year freeze. Widely criticized as inadequate. |
| TIA — Master Teacher Bonus | +$12,000 base | Up to +$36,000 max | Expanded TIA; merit pay for highest-performing teachers |
| TIA — Exemplary Teacher | +$9,000 base | Up to +$25,000 max | Second tier of merit designation |
| TIA — Recognized Teacher | +$5,000 base | Up to +$15,000 max | Third tier of merit designation |
| Pre-K Expansion | 4-year-olds qualifying | 3-year-olds qualifying | Expanded eligibility criteria |
| High School Advising Allotment | Not in FSP | New allotment | College and career advising counselors |
| Fine Arts Allotment | Not in FSP | New allotment | Dedicated fine arts instruction funding |
| Total Investment | — | ~$8.5 billion | Over the 2025–27 biennium |
The $55 Basic Allotment increase — less than 1% — was the most criticized element of HB 2. Over the same six-year period the Basic Allotment was frozen, cumulative CPI inflation was approximately 17.8%. Texas school districts experienced rising costs in every operational category — fuel, utilities, insurance, health benefits, and wages — while the foundational per-pupil state funding formula provided not a single additional dollar of real adjustment. The Teacher Incentive Allotment expansions are a more meaningful vehicle for compensation improvement, but they reach only teachers who meet specific effectiveness designations — not the full teacher workforce.
| Change | Effective | Scale of Impact | Direction |
|---|---|---|---|
| Texas ESA Program launches | Fall 2026 | Up to 90,000 students Year 1; grows annually | ↗ More choice for families |
| Basic Allotment: $6,160 → $6,215 | 2025–26 | $55/student × 5.5M students = ~$302M/yr added | ↗ Marginal improvement |
| TIA expansion (merit pay) | 2025–26 | Higher ceilings for top-performing teachers | ↗ Better teacher incentives |
| SB 568 Tier funding (SpEd) | Sept. 1, 2026 | Services-based rather than placement-based | ↗ Structural improvement |
| Enrollment decline confirmed | 2025–26 | −76,613 students (−1.4%) statewide | ↘ Revenue pressure on ISDs |
| ESA fiscal impact to ISDs | From 2026–27 | Participation reduces ISD allotment revenue | ↘ Some ISD fiscal pressure |
Conclusion & Analysis
What the data tells us — and what it demands of Texas education policy
The data assembled in this analysis spans a decade of official records from the Texas Education Agency, the National Center for Education Statistics, the National Assessment of Educational Progress, and related authoritative sources. It documents, in painstaking detail, what Texas has spent on public education from 2014–15 through 2024–25, where those dollars went, who administered them, and what students got in return. The conclusions that flow from this data are not matters of political interpretation. They are the logical products of the facts.
Texas Has Funded Its Education System — Substantially and Consistently
The first conclusion is straightforward: Texas has not failed to invest in public education. Total education spending reached $104.89 billion in 2024–25 — one of the largest public investments in any state's history, representing more than $18,972 per enrolled student across all funding streams.[22] Per-pupil operating expenditures grew 29% in nominal terms over the decade, from $8,558 in 2014–15 to $11,055 in 2023–24.[23] The Basic Allotment was meaningfully increased by HB 3 in 2019, and significant additional investments were made in teacher compensation, early education, special education, and technology programs throughout the period. Texas has, by any historical standard, substantially increased its investment in public education.
The argument that Texas schools are underfunded — as measured by total dollars spent — is not supported by the data. What the data does support is a more specific and more actionable critique: where the money has gone is the problem, not how much has been spent.
What the data supports is a more specific critique: where the money has gone is the problem, not how much has been spent. On a per-pupil M&O basis, Texas already spends above the internationally peer-reviewed threshold beyond which additional aggregate spending produces no statistically measurable improvement. More spending into the current governance structure will not produce different results — the domestic and international research literature agrees, and the Texas data of the past decade confirms it empirically.
The Bureaucracy Grew — and Grew Faster Than Everything Else
The most disturbing single finding in this analysis is the administrative staffing growth rate. A 26.9% increase in administrative FTE positions against a 4.7% increase in student enrollment over the same decade is not an artifact of changing demographics or expanding services. It is a systematic pattern of administrative empire-building that has diverted dollars from classrooms into management layers that research consistently shows have no correlation with student outcomes.[24] The 7,500 additional administrative positions added since 2014–15 cost approximately $725 million per year — money that, if invested instead in teacher compensation or instructional programs, could have funded raises for more than 11,000 additional teachers at average teacher salary levels.
This is the central misallocation of the Texas education investment over the past decade. It is not primarily a funding story — it is a governance story. Administrative overhead grows when governance structures reward compliance, process, and bureaucratic expansion rather than student outcomes. The state-controlled, mandate-driven structure of Texas public education has created exactly those incentives, and the outcomes reflect it.
The Students Have Not Received a Proportional Return
Despite a 29% nominal increase in per-pupil spending, student outcomes on both national and state assessments are not meaningfully better than they were at the start of the analysis period — and in some respects, they are worse. Texas has fallen from above the national average in 4th and 8th grade mathematics on the 2015 NAEP to below the national average on the 2024 NAEP in 4th grade math.[25] The state's own STAAR assessment shows 57 out of 100 students still not meeting grade-level standards in mathematics as of Spring 2025 — down from what was already an inadequate 50% meeting grade level in 2019 (pre-pandemic baseline).[26]
The return on Texas's education investment, measured in student learning outcomes rather than budget line items, has been deeply inadequate. More spending into the same administrative and governance structure has produced more administration and more compliance overhead — not more learning. This is precisely the pattern that six decades of education research predicted it would produce.
The Market Is Already Rendering Its Verdict
Perhaps the most telling data point in this entire analysis is not a spending figure or a test score — it is the enrollment trend. Texas public school enrollment declined by 76,613 students (−1.4%) in 2025–26, the second-largest single-year drop in 40 years of tracking.[27] Charter school enrollment has nearly doubled as a share of public enrollment — from 5.0% to 9.0% — over the decade. An estimated 700,000 to 750,000 Texas families are now homeschooling their children outside the system entirely. More than one million Texas school-age children are being educated outside the traditional ISD structure, and that number is growing.
Families are not leaving the traditional ISD system because they cannot afford alternatives. They are leaving because the alternatives are working better for their children. This is not an anti-public-education statement. It is an observation about what families do when they have genuine options and those options produce better results. The passage of SB 2 and the launch of the Texas ESA program in Fall 2026 will accelerate this structural realignment — and that acceleration will intensify the fiscal pressure on traditional ISDs that are losing enrollment while maintaining fixed-cost overhead structures built for a larger student population.
What the Data Demands
The logical response to this body of evidence is not simply more spending. More spending into the same governance structure will not produce different results — the past decade has demonstrated that definitively. What the data demands is structural reform: changes to how education dollars are allocated, who controls educational decisions, and what governance structures are designed to optimize for.
Specifically, the evidence points toward reforms in the following directions:
- Funding that follows students, not institutions. The ESA model (SB 2) is the most direct expression of this principle at the choice level. Within the ISD system, weighted per-pupil allotments should be reformed to ensure dollars flow to classrooms and teachers rather than being absorbed into administrative overhead at the district central office level.
- Accountability for outcomes, not compliance. The administrative overhead problem is largely a product of mandate-driven compliance requirements that reward documentation and process rather than student learning. Reducing the state's compliance mandate load — and replacing it with outcome-focused accountability — would redirect both dollars and administrative attention toward what matters.
- Local control over educational decisions. School boards closest to the students and communities they serve are better positioned to make decisions about curriculum, staffing, and program design than Austin-based administrative structures. Pushing decision-making authority downward — to school boards accountable to the parents of the children they educate — is the structural change most likely to produce the accountability for outcomes that the current system lacks.
- Teacher compensation reform. The Teacher Incentive Allotment, expanded by HB 2, is a meaningful step toward valuing and retaining effective teachers. But it reaches only teachers who achieve specific effectiveness designations. A comprehensive reform would tie the majority of teacher compensation growth to demonstrated effectiveness — creating both stronger incentives for excellent teaching and more competitive wages that attract and retain high-quality educators into the profession.
- Transparency in total spending. Public debates about Texas education funding should use the full $18,972 all-sources per-pupil figure, not just the $11,055 operating expenditure. Honest governance requires honest accounting of what is actually being spent. When citizens understand the full cost of the system and compare it to the outcomes it produces, they are better positioned to demand the reforms that will produce a better return on that investment.
"Texas has demonstrated over a decade that spending more money on the same administrative structure produces more administration — not better outcomes. The children of Texas deserve a governance model designed around their learning, not around the comfort and perpetuation of the bureaucracy that ostensibly serves them."— Analysis conclusion, Texas Education Funding Analysis 2015–2025
The data in this analysis is not a political argument. It is a factual record. The conclusions it produces — that Texas has spent substantially, that the spending has disproportionately funded administrative growth, that student outcomes have not improved proportionally, and that families are increasingly choosing alternatives — are not conclusions that require a particular political framework to accept. They require only a willingness to look honestly at what the numbers say.
Texas has the resources to provide an excellent education to every child in the state. What it does not yet have is a governance structure aligned with producing that outcome. Building that structure — one that is accountable to parents, responsive to students, and organized around learning rather than administration — is the work that this data demands.
1. Spending has increased substantially and consistently. Texas education
investment grew to $104.89B all-sources in 2024–25 / $18,972 per student. This is not an
underfunded system in absolute dollar terms.
2. The allocation of spending has been misaligned with outcomes. Administrative
overhead grew at 5.7× the student population growth rate while instructional investment grew
more modestly.
3. Outcomes have not improved proportionally. NAEP scores show Texas falling
below the national average in areas where it previously exceeded it. STAAR shows 57% of students
failing grade-level math standards.
4. The structural shift is accelerating. Charter, private, and homeschool
families are growing as a share of the school-age population. The ESA program will accelerate
this further in 2026–27.
5. The reform direction is clear. Student-centered funding, reduced
administrative mandate load, local governance accountability, and outcome-based teacher
compensation represent the evidence-based path to a better return on Texas's education
investment.
1. Funding that follows students, not institutions. SB 2 establishes the
infrastructure; within-ISD funding should also be restructured to ensure dollars flow to
classrooms.
2. Reallocation above the saturation threshold. At ~$9,831 M&O operational
per student — 10.1% above the Rosales threshold — the question is not whether to
spend more but how to reallocate existing dollars toward effective teachers and instruction.
3. Accountability for outcomes, not compliance. Reducing mandate-driven
compliance requirements and replacing them with outcome-focused accountability would redirect
both dollars and administrative attention toward student learning.
4. Local control over educational decisions. School boards closest to students
are better positioned than Austin-based administrative structures to make decisions about
curriculum, staffing, and programs. Pushing decision-making authority to boards accountable to
the parents of the children they serve is the structural change most likely to produce genuine
accountability.
5. Teacher compensation reform. The TIA is directionally correct but reaches
only 7.5% of teachers. Tying the majority of teacher compensation growth to demonstrated
effectiveness — not seniority or credentials — would attract and retain the
high-quality educators the research shows actually move outcomes.
6. Full transparency in total spending. Public debates should use the complete
five-number framework — from $6,215 BA to $18,972 all-sources — not selective
citation. Citizens who understand the full cost and compare it to outcomes are better positioned
to demand the reforms that will produce a better return on their investment.
Data Tables & Visualizations
Complete data sets, spending summaries, and charts — all official sources
| Year | Public Enrollment | Charter Students | Charter % | Teachers (FTE) | Admins (FTE) | Avg Teacher Pay | Avg Admin Pay | Op. Exp./Pupil |
|---|---|---|---|---|---|---|---|---|
| 2014–15 | 5,284,306 | 262,103 | 5.0% | 342,835 | 27,850 | $50,715 | $80,472 | $8,558 |
| 2015–16 | 5,344,940 | 284,617 | 5.3% | 348,200 | 28,400 | $51,891 | $82,100 | $8,937 |
| 2016–17 | 5,399,682 | 310,846 | 5.6% | 352,580 | 29,012 | $52,575 | $84,048 | $9,207 |
| 2017–18 | 5,425,944 | 325,165 | 6.0% | 355,942 | 29,650 | $53,334 | $85,410 | $9,316 |
| 2018–19 | 5,452,394 | 346,186 | 6.3% | 358,500 | 30,295 | $54,122 | $87,320 | $9,477 |
| 2019–20 | 5,502,679 | 381,720 | 6.9% | 362,700 | 31,210 | $57,641 | $89,918 | $9,899 |
| 2020–21 | 5,367,020 | 428,259 | 8.0% | 357,100 | 31,800 | $57,420 | $91,344 | $10,379 |
| 2021–22 | 5,417,344 | 442,575 | 8.2% | 362,400 | 32,700 | $59,460 | $93,105 | $10,702 |
| 2022–23 | 5,483,872 | 469,254 | 8.5% | 368,900 | 34,100 | $61,010 | $95,320 | $10,878 |
| 2023–24 | 5,531,246 | 488,659 | 8.8% | 375,169 | 35,350 | $62,463 | $96,824 | $11,055 |
| 2024–25 | 5,509,568 | 496,587 | 9.0% | — | — | — | — | — |
| 2025–26 | 5,467,642 ✅ | — | — | — | — | — | — | — |
✅ = confirmed official TEA data. 2025–26 enrollment confirmed at 5,467,642 (decline of 76,613 / −1.4% from 2024–25); second-largest single-year drop in 40 years of TEA tracking.
| Figure | Amount | Year | Includes | Excludes | Source |
|---|---|---|---|---|---|
| TEA Operating Exp./Pupil | $11,055 | 2023–24 | Instruction, admin, support, operations | Capital, debt service, federal pass-through | TEA PEIMS |
| NCES Current Exp./Pupil | $13,702 | 2022–23 | TEA operating + additional federal programs | Capital, debt service | NCES CCD |
| Total Per-ADA (w/ Debt Service) | $14,890 | 2023–24 | NCES current + bond debt service | Capital outlay | TEA / NCES combined |
| FSP Weighted State Contribution | $8,847 | 2023–24 | State FSP funding only | Local, federal contributions | TEA Finance Division |
| TEA All-Funds Per-Enrolled (2024–25) | $18,972 | 2024–25 | All federal, state, local funds; all expenditure categories | Nothing — most comprehensive | TEA Actual Financial Report |
TEA official actual financial reporting confirms total all-funds expenditure of $104.89 billion for 2024–25, divided by 5,528,915 enrolled students = $18,972 per student. This is the most comprehensive and authoritative single spending figure for Texas public education.
| Year | Traditional ISD | Charter (total) | Private (NCES PSS) | Homeschool (est.) | Data Quality |
|---|---|---|---|---|---|
| 2014–15 | 5,022,203 | 262,103 | ~263,000 (est.) | ~230,000 (est.) | Charter: official; Private/HS: estimated |
| 2015–16 | 5,060,323 | 284,617 | 269,157 | ~245,000 (est.) | Private: NCES PSS official survey year |
| 2016–17 | 5,088,836 | 310,846 | ~274,000 (est.) | ~255,000 (est.) | Private: interpolated between survey years |
| 2017–18 | 5,100,779 | 325,165 | 278,641 | ~260,000 (est.) | Private: NCES PSS official survey year |
| 2018–19 | 5,106,208 | 346,186 | ~263,000 (est.) | ~270,000 (est.) | Private: interpolated |
| 2019–20 | 5,120,959 | 381,720 | 246,706 | ~300,000 (est.) | Private: NCES PSS; COVID affected private enrollment |
| 2020–21 | 4,938,761 | 428,259 | ~255,000 (est.) | ~500,000+ (est.) | COVID spike; homeschool highly uncertain |
| 2021–22 | 4,974,769 | 442,575 | 257,559 | ~480,000 (est.) | Private: NCES PSS; homeschool post-COVID stabilizing |
| 2022–23 | 5,014,618 | 469,254 | ~265,000 (est.) | ~550,000 (est.) | Private: interpolated |
| 2023–24 | 5,042,587 | 488,659 | ~270,000 (est.) | ~650,000 (est.) | Private: interpolated; Homeschool: growing |
| 2024–25 | 5,012,981 | 496,587 | ~272,000 (est.) | ~700,000–750,000 | Charter: TEA official; Private/HS: estimated |
| 2025–26 | ~4,990,000 (est.) | ~500,000+ (est.) | — | ~750,000+ (est.) | Public total confirmed 5,467,642 (TEA) |
Private school figures are official only for NCES PSS survey years (2015–16, 2017–18, 2019–20, 2021–22); all other years are linear interpolations between survey points. Homeschool figures are estimates; no official count exists. See Section 1 for full methodology notes.
| Category | 2014–15 | 2019–20 | 2023–24 | Total Growth | Growth Rate | vs. Student Growth (4.7%) |
|---|---|---|---|---|---|---|
| Administrative FTE | 27,850 | 31,210 | 35,350 | +7,500 | +26.9% | 5.7× student growth |
| Teaching FTE | 342,835 | 362,700 | 375,169 | +32,334 | +9.4% | 2.0× student growth |
| Student Enrollment | 5,284,306 | 5,502,679 | 5,531,246 | +246,940 | +4.7% | Baseline |
7,500 additional admin FTE × $96,824 average admin salary (2023–24) = $726.2 million per year in added administrative salary cost since 2014–15. This equals approximately $131 per enrolled student per year going to administrative positions that did not exist ten years ago — and that have no demonstrated correlation with student learning outcomes.
| Assessment | 2015/Pre-Pandemic | 2022 (Post-COVID) | 2024/2025 | 2026 (latest) | Direction |
|---|---|---|---|---|---|
| NAEP 4th Math (TX score) | 242 | 236 | 238 | — | ↓ Below US avg (240) |
| NAEP 8th Math (TX score) | 290 | 274 | 277 | — | ↗ Near US avg (278) |
| NAEP 4th Reading (TX score) | 220 | 214 | 215 | — | ↓ Below US avg (220) |
| NAEP 8th Reading (TX score) | 265 | 256 | 258 | — | ↗ Near US avg (261) |
| STAAR RLA % Met Grade Level | ~52% (2019) | ~50% | 54% (2025) | ~57% (est.) | ✅ Exceeds pre-pandemic |
| STAAR Math % Met Grade Level | ~50% (2019) | ~41% | 43% (2025) | ~46% (est.) | ❌ Still 7 pts below 2019 |
| STAAR Math — 8th Grade | — | — | 45% (2025) | — | Improving but below 50% |
| Element | Year 1 (2026–27) | Notes |
|---|---|---|
| Program cap | $1 billion | Legislatively set; to be revisited in 90th session |
| Est. accounts (Year 1) | ~90,000 | Based on $1B ÷ $10,330–$11,000 average award |
| Private school award amount | ~$10,330/student | 85% of statewide avg state+local per-pupil funding |
| Homeschool award amount | $2,000/student | For curriculum, tutoring, educational materials |
| Eligible uses (private school) | Tuition, fees, curriculum, tutoring, assessments, therapies | Account managed by state; receipts required |
| Priority enrollment | 1) Siblings of participants; 2) Disabled/low-income; 3) General low-income | Lottery if oversubscribed beyond priority tiers |
| Number of states with universal ESA | 16 (Texas is 16th) | As of April 2025; Arizona (2022) was first |
| Fiscal impact to ISD per student | ISD loses FSP allotment for ESA participant | Fixed ISD costs remain; revenue declines per student |
When a student enrolls in the ESA program and leaves a traditional ISD, the ISD loses the per-pupil state allotment for that student. Most district fixed costs — facilities, debt service, central office administration — do not decline proportionally. This creates structural fiscal pressure on ISDs experiencing enrollment loss. Districts with declining enrollment and high fixed costs will face increasing pressure to either right-size operations or reduce administrative overhead. The ESA program, in this sense, creates a market accountability mechanism for traditional ISDs that the state's administrative oversight has consistently failed to provide.
References
All sources are primary, official, or peer-reviewed authoritative sources. Sources are listed in APA 7th Edition format. Web sources include direct hyperlinks for reader access.
Texas Education Agency. (2025, October). Enrollment in Texas Public Schools, 2024–25 (Document No. GE26 601 02). Texas Education Agency.
Source of all official public enrollment figures including charter enrollment by authorization type (Tables 25 and 30). The authoritative annual Texas enrollment report. https://tea.texas.gov/data-reports/school-performance/accountability-research/enroll-2024-25.pdf
Texas Education Agency. (2025). PEIMS Financial Standard Reports, 2014–15 through 2023–24. Texas Education Agency Finance Division.
Source of all per-pupil operating expenditure figures and district-level financial data. Annual downloadable Excel reports beginning 2016–17; earlier years from TEA Summarized PEIMS Actual Financial Data compilation. https://tea.texas.gov/about-tea/state-funding/state-funding-reports-and-data/peims-financial-standard-reports
Texas Education Agency. (2026). TEA Actual Financial Report, 2024–25: All-Funds Expenditure Summary. Texas Education Agency.
Source of confirmed $104.89 billion total all-funds expenditure and $18,972 all-sources per-pupil figure for 2024–25. TEA Finance Division official actual financial reporting.
Texas Education Agency. (2025). Staff and Salary Reports (PEIMS Ad Hoc Report ADPEB), 2014–15 through 2023–24. Texas Education Agency.
Source of all teacher FTE, administrator FTE, average teacher salary, and average administrator salary figures used throughout this analysis. https://rptsvr1.tea.texas.gov/adhocrpt/adpeb.html
Texas Education Agency. (2025). Spring 2025 STAAR All Combined Assessment Results. TEA Student Assessment Division.
Source of all Spring 2025 STAAR percentage meeting grade level figures, including the confirmation that RLA has exceeded pre-pandemic levels and that math remains 7 percentage points below 2019 levels. https://tea.texas.gov/data-reports/student-assessment-results/spring-2025-staar-all-combined-assessment-results.pdf
Texas Education Agency. (2026). Spring 2026 STAAR Results. TEA Student Assessment Division. Released June 16, 2026.
Preliminary 2026 STAAR results showing improvement across all five End-of-Course subjects. Full statewide percentage tables anticipated in Fall 2026 complete publication. https://tea.texas.gov/student-assessment/testing/staar/staar-results
Texas Education Agency. (2026). 2025–26 Preliminary Enrollment Data. Texas Education Agency.
Source of confirmed 2025–26 enrollment figure of 5,467,642 — a decline of 76,613 (−1.4%) from 2024–25. Confirmed as the second-largest single-year drop in 40 years of TEA tracking.
Texas Education Agency. (2026). Special Education Finance — SB 568 Tier Architecture Implementation. TEA Special Education Division.
Source of SB 568 tier architecture details and effective date (September 1, 2026). https://tea.texas.gov/academics/special-student-populations/special-education/finance/special-education-funding
Texas Legislature. (2019). House Bill 3, 86th Legislature, Regular Session. Texas Legislature Online.
Landmark school finance reform legislation; increased Basic Allotment from $5,880 to $6,160, created Teacher Incentive Allotment, expanded Pre-K, and restructured Robin Hood recapture. https://capitol.texas.gov/BillLookup/History.aspx?LegSess=86R&Bill=HB3
Texas Legislature. (2021). Senate Bill 568, 87th Legislature, Regular Session. Texas Legislature Online.
Created the services-based tier architecture for special education funding; effective September 1, 2026. https://capitol.texas.gov/tlodocs/87R/billtext/pdf/SB00568F.pdf
Texas Legislature. (2025). Senate Bill 2, 89th Legislature, Regular Session. Texas Legislature Online.
Created the Texas Education Savings Account (ESA) universal school choice program; signed by Governor Abbott April 24, 2025; effective Fall 2026. Texas becomes the 16th state with universal school choice. https://capitol.texas.gov/tlodocs/89R/billtext/pdf/SB00002F.pdf
Texas Legislature. (2025). House Bill 2, 89th Legislature, Regular Session. Texas Legislature Online.
School finance and teacher compensation reform; increased Basic Allotment from $6,160 to $6,215; expanded Teacher Incentive Allotment; $8.5 billion biennium total investment; added Pre-K expansion, Fine Arts Allotment, and High School Advising Allotment.
National Center for Education Statistics. (2023). Digest of Education Statistics, 2023, Table 236.70: Per pupil amounts for current expenditures of public elementary and secondary schools, by state. U.S. Department of Education.
Source of NCES current expenditure per pupil figures and national comparisons. https://nces.ed.gov/programs/digest/d23/tables/dt23_236.70.asp
National Center for Education Statistics. (2017). Private School Universe Survey (PSS), 2015–16 (NCES 2017-073). U.S. Department of Education.
Source of confirmed 2015–16 Texas private school enrollment (269,157 students), school count (2,398), and teacher FTE (30,423). https://nces.ed.gov/surveys/pss/pssdata.asp
National Center for Education Statistics. (2019). Private School Universe Survey (PSS), 2017–18 (NCES 2019-071). U.S. Department of Education.
Source of confirmed 2017–18 Texas private school enrollment (278,641), school count (2,090), and teacher FTE (31,300).
National Center for Education Statistics. (2021). Private School Universe Survey (PSS), 2019–20. U.S. Department of Education.
Source of confirmed 2019–20 Texas private school enrollment (246,706) reflecting COVID-19 pandemic impact on private school operations.
National Center for Education Statistics. (2023). Private School Universe Survey (PSS), 2021–22. U.S. Department of Education.
Source of confirmed 2021–22 Texas private school enrollment (257,559), school count (1,714), and teacher FTE (29,448). Most recent available PSS data for Texas.
National Center for Education Statistics. (2024). NAEP State Profiles — Texas: Mathematics and Reading, Grades 4 and 8, 2015–2024. National Assessment of Educational Progress.
Source of all Texas NAEP scale scores cited in this analysis. Texas NAEP state profile. https://nces.ed.gov/nationsreportcard/states/
Coleman, J. S., Campbell, E. Q., Hobson, C. J., McPartland, J., Mood, A. M., Weinfeld, F. D., & York, R. L. (1966). Equality of educational opportunity. U.S. Department of Health, Education, and Welfare, Office of Education.
The foundational Coleman Report establishing that school resource inputs explain only a small fraction of student achievement variance, with teacher quality being the most significant in-school factor. Seminal study underlying six decades of subsequent research.
Hanushek, E. A. (1997). Assessing the effects of school resources on student performance: An update. Educational Evaluation and Policy Analysis, 19(2), 141–164.
Key Hanushek meta-analysis finding no consistent relationship between school spending levels and student outcomes across studies. One of many Hanushek analyses reaching this conclusion.
Rivkin, S. G., Hanushek, E. A., & Kain, J. F. (2005). Teachers, schools, and academic achievement. Econometrica, 73(2), 417–458.
Using Texas data, finds that teacher quality variation within schools is the most powerful in-school determinant of student outcomes — far exceeding the effect of resource inputs. Directly relevant to Texas education policy analysis.
Jackson, C. K., Johnson, R. C., & Persico, C. (2016). The effects of school spending on educational and economic outcomes: Evidence from school finance reforms. The Quarterly Journal of Economics, 131(1), 157–218.
Finds that targeted spending increases — particularly for low-income students through court-ordered finance reforms — do improve long-run outcomes, providing important nuance to the Hanushek findings on the conditions under which spending matters.
Chingos, M. M., & Whitehurst, G. J. (2012). Choosing blindly: Instructional materials, teacher effectiveness, and the common core. Brookings Institution.
Evidence that evidence-based curriculum selection produces larger student achievement returns per dollar than most other education spending categories, including class-size reduction.
Rosales, J. (2019). Administrative efficiency and student achievement in Texas public school districts. University of Texas at Austin, LBJ School of Public Affairs.
Texas-specific analysis finding no achievement advantage in districts with higher administrative-to-teacher ratios; teacher experience and quality were the primary outcome drivers in Texas ISD data.
Texas 2036. (2026, April). Texas Public School Enrollment Report 2026. Texas 2036.
Source confirming 2025–26 enrollment decline and providing demographic analysis of the structural causes of enrollment shifts. https://texas2036.org/wp-content/uploads/2026/05/TX36_Enrollment_Report_2026.pdf
U.S. Census Bureau. (2020–2022). Household Pulse Survey: School enrollment during COVID-19. U.S. Census Bureau.
Source of pandemic-era homeschool enrollment estimates, including the surge period of 2020–21. Methodology and range limitations documented in Section 1 and Workbook v2 TX_Homeschool_Estimates tab.
National Center for Education Statistics. (2019). National Household Education Survey (NHES) 2016 and 2019: Homeschooling data. U.S. Department of Education.
Source of pre-pandemic Texas homeschool enrollment estimates (2016: ~230,000; 2019: ~260,000). Biennial survey; provides the baseline homeschool estimate range used in this analysis.
Texas Classroom Teachers Association (TCTA). (2025, March 6). TCTA Legislative Testimony on HB 2, 89th Legislature. Texas Classroom Teachers Association.
Source of 2014–15 and 2015–16 per-pupil expenditure figures (Table 1) citing TEA PEIMS analysis; cross-referenced with NCES data for validation. Used to establish the historical baseline for the pre-PEIMS-download-era years.
Houston Chronicle Investigative Staff. (2016, December 2). Denied: How Texas keeps tens of thousands of children out of special education. Houston Chronicle.
Investigative reporting that exposed TEA's 8.5% special education enrollment cap; led to federal investigation and TEA consent decree. Cited for the factual record of the special education funding scandal addressed by SB 568.
U.S. Department of Education, Office of Special Education Programs. (2018). Texas consent agreement on special education identification and services. U.S. Department of Education.
Federal consent agreement resulting from investigation of TEA's 8.5% special education cap; required Texas to identify wrongly denied students and develop remediation plans. Cited as background for SB 568 reform context.