
The Economic Resilience of Texas - Sales Taxes Justified
Texas Economic Resilience Through the Inflation Era
Evidence That a 5% Flat Sales Tax Will Not Suppress Economic Activity
The Challenge This Article Addresses
Critics of replacing property taxes with a flat sales tax argue that broadening the sales tax base — even at a lower or stable rate — will suppress consumer spending, discourage business investment, and shrink economic activity. The theory is that adding a tax on previously exempt items (groceries, medicine, agricultural inputs, business services) will impose a price shock that reduces transaction volume.
This article answers that challenge with five years of primary-source data from the Texas Comptroller, the U.S. Bureau of Economic Analysis, and the U.S. Bureau of Labor Statistics — data covering the worst inflationary period in 40 years. The evidence shows not only that Texas economic activity proved completely resilient through a price shock far larger than a 5% sales tax would create, but that it grew substantially in real terms throughout that period.
Part I: The Inflation Benchmark — What Texans Actually Absorbed From 2019 to 2024
Before evaluating whether a 5% flat sales tax would suppress economic activity, we need to establish what price shock would result. That requires comparing it to what Texas consumers and businesses already absorbed through the 2021–2023 inflation surge.
National and Regional Inflation: The Official Record
The U.S. Bureau of Labor Statistics publishes monthly Consumer Price Index data for both the national average and the Dallas-Fort Worth metro area, the largest market in Texas. The annual average CPI-U values from 2019 through 2024 are as follows (U.S. Bureau of Labor Statistics, 2026a; 2026b):
| Year | U.S. CPI-U (Annual Avg) | DFW CPI-U (Annual Avg) | US YoY Change | DFW YoY Change |
|---|---|---|---|---|
| 2019 | 255.7 | 237.6 | — | — |
| 2020 | 258.8 | 239.0 | +1.2% | +0.6% |
| 2021 | 271.0 | 251.1 | +4.7% | +5.1% |
| 2022 | 292.7 | 273.2 | +8.0% | +8.8% |
| 2023 | 304.7 | 287.6 | +4.1% | +5.3% |
| 2024 | 313.7 | 299.0 | +3.0% | +4.0% |
| Cumulative 2019–2024 | — | — | +22.7% | +25.8% |
Sources: U.S. Bureau of Labor Statistics (2026a). Consumer Price Index Historical Tables for U.S. City Average; BLS Southwest Region. Consumer Price Index, Dallas-Fort Worth-Arlington area.
The peak single-year inflation in June 2022 reached 9.1% nationally — the largest 12-month increase since November 1981 (U.S. Bureau of Labor Statistics, 2022). In the DFW metro, prices rose a cumulative 25.8% from 2019 through 2024. Food at home nationally rose 12.2% in a single year (2022) (U.S. Bureau of Labor Statistics, 2023). Energy prices rose 41.6% in that same year. These are not marginal price adjustments — they represent massive, across-the-board cost increases applied to virtually every transaction in the Texas economy.
The 5% Rate in Context: A Direct Mathematical Comparison
A proposed flat 5% sales tax rate, applied to transactions currently exempt, creates a one-time structural price adjustment on those specific categories. Compare that to what inflation already imposed:
| Price Shock | Magnitude | Scope | Consumer Choice |
|---|---|---|---|
| Peak single-year U.S. inflation (June 2022) | 9.1% | All goods and services | None — involuntary |
| DFW single-year spike, 2021–2022 | 8.8% | All goods and services | None — involuntary |
| Cumulative U.S. CPI increase, 2019–2024 | 22.7% | All goods and services | None — permanent |
| Cumulative DFW CPI increase, 2019–2024 | 25.8% | All goods and services | None — permanent |
| Proposed 5% flat sales tax | 5.0% | Currently exempt items only | Known in advance; stable |
The math is direct and unambiguous: the single worst year of inflation (9.1%) was 1.8 times larger than the proposed 5% rate. The cumulative DFW inflation over five years (25.8%) was 5.2 times larger than the proposed 5% rate.
For a consumer buying groceries — the category critics most frequently cite as a concern — the arithmetic is equally clear. A $100 grocery bill subject to the 25.8% cumulative DFW CPI increase already costs $125.80 in 2024 compared to 2019. Adding a 5% sales tax on that same $100 pre-inflation base adds $5.00 — which is less than one-fifth of the price increase inflation already imposed.
The Texas Comptroller's FY2025 Tax Exemptions and Tax Incidence Report places the total foregone state sales tax revenue on food for home consumption at approximately $4.30 billion, implying a food retail sales base of roughly $68.8 billion annually (Texas Comptroller of Public Accounts, 2025c). A 5% rate on that base generates approximately $3.44 billion in revenue while costing the average Texas household approximately $320 per year in new grocery taxes — far less than the average Texas property tax burden of approximately $8,058 per household per year, calculated from the Comptroller's reported 2024 total property tax levy of $86.6 billion (Texas Policy Research, 2025; Texans for Fiscal Responsibility, 2025).
Part II: What Texas Economic Data Actually Shows — Real Growth Through Historic Price Inflation
The central empirical test of the critics' claim is this: if rising prices suppress economic activity, then the 2021–2023 inflation surge — which imposed a price shock far greater than any flat sales tax rate being proposed — should have measurably contracted Texas economic output, taxable sales volumes, and employment. The data from every primary official source shows the opposite occurred.
Texas Real Gross Domestic Product (Bureau of Economic Analysis)
The Bureau of Economic Analysis publishes annual real GDP data for each state through the FRED database (series TXRGSP), measured in chained 2017 dollars to strip out all price-level effects (Bureau of Economic Analysis via FRED, 2025):
| Year | Texas Real GDP (Chained 2017$) | Year-over-Year Change |
|---|---|---|
| 2019 | $1.807 trillion | — |
| 2020 | $1.783 trillion | −1.3% (COVID-19) |
| 2021 | $1.906 trillion | +6.9% |
| 2022 | $1.975 trillion | +3.6% ← Peak inflation year |
| 2023 | $2.138 trillion | +8.3% |
| 2024 | $2.222 trillion | +3.9% |
| Cumulative 2019–2024 | — | +23.0% |
Source: U.S. Bureau of Economic Analysis via Federal Reserve Bank of St. Louis. FRED Series TXRGSP (2025, September 26).
In 2024, Texas produced $2.222 trillion worth of goods and services in 2017 purchasing power — meaning the 23.0% growth figure entirely excludes inflation. The Texas economy produced 23 cents of additional real output for every 2019 dollar of output, even as prices rose 22.7% nationally and 25.8% in DFW.
Critically, 2022 and 2023 — the peak inflation years — posted strong real GDP growth of 3.6% and 8.3% respectively. The year of peak inflation (9.1% in June 2022) saw real economic output expand by 3.6% in real terms. Economic activity did not contract under the worst inflation in 40 years; it accelerated through it.
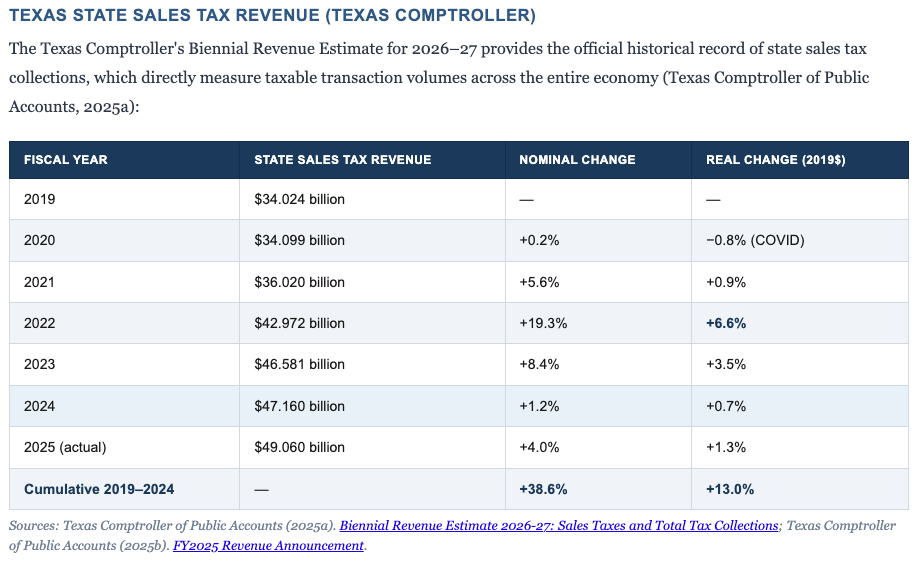
Texas State Sales Tax Revenue (Texas Comptroller)
The Texas Comptroller's Biennial Revenue Estimate for 2026–27 provides the official historical record of state sales tax collections, which directly measure taxable transaction volumes across the entire economy (Texas Comptroller of Public Accounts, 2025a):
| Fiscal Year | State Sales Tax Revenue | Nominal Change | Real Change (2019$) |
|---|---|---|---|
| 2019 | $34.024 billion | — | — |
| 2020 | $34.099 billion | +0.2% | −0.8% (COVID) |
| 2021 | $36.020 billion | +5.6% | +0.9% |
| 2022 | $42.972 billion | +19.3% | +6.6% |
| 2023 | $46.581 billion | +8.4% | +3.5% |
| 2024 | $47.160 billion | +1.2% | +0.7% |
| 2025 (actual) | $49.060 billion | +4.0% | +1.3% |
| Cumulative 2019–2024 | — | +38.6% | +13.0% |
Sources: Texas Comptroller of Public Accounts (2025a). Biennial Revenue Estimate 2026-27: Sales Taxes and Total Tax Collections; Texas Comptroller of Public Accounts (2025b). FY2025 Revenue Announcement.
After adjusting for inflation, Texas collected 13.0% more in real sales tax revenue in 2024 than in 2019. This represents an increase in actual transaction volume — more goods and services purchased, not merely more dollars changing hands due to inflation.
The Comptroller's own monthly announcements have repeatedly confirmed that collections are growing faster than inflation. Acting Comptroller Kelly Hancock stated in February 2026: "State sales tax collections were very strong last month, with growth well above the rate of general price inflation" (Texas Comptroller of Public Accounts, 2026a). In November 2025: "Overall, state sales tax collections grew faster than general price inflation. This reflects a Texas economy that continues to expand at a moderate pace" (Texas Comptroller of Public Accounts, 2025e).
Texas Taxable Sales Volume (Texas Comptroller Quarterly Reports)
The Comptroller's Quarterly Sales Tax Historical Data provides a direct measure of the dollar volume of all taxable transactions in Texas (Texas Comptroller of Public Accounts, 2026b):
| Year | Statewide Taxable Sales (Nominal) | Nominal Change | Real Change (2019$) |
|---|---|---|---|
| 2019 | $556.9 billion | — | — |
| 2020 | $511.8 billion | −8.1% (COVID) | −9.2% |
| 2021 | $627.6 billion | +22.6% | +14.5% |
| 2022 | $716.6 billion | +14.2% | +6.3% |
| 2023 | $750.7 billion | +4.8% | −0.2% |
| 2024 | $768.0 billion | +2.3% | +0.9% |
| Cumulative 2019–2024 | — | +37.9% | +12.4% |
Source: Texas Comptroller of Public Accounts (2026b). Quarterly Sales Tax Historical Data: Statewide Grand Totals, All Industries, 2019–2025.
The real 12.4% growth in taxable sales volume is the most direct empirical refutation of the critics' thesis. This number answers the question: did Texas consumers and businesses buy more or less stuff, by volume, after facing the worst inflation in four decades? The answer is 12.4% more — not less.
Texas Employment and Population (TWC and U.S. Census Bureau)
The Texas Workforce Commission reports that Texas reached 14,341,000 total nonfarm jobs in December 2025, with 132,500 jobs added over 2025 at a 0.9% annual growth rate that outpaced the national rate (Texas Workforce Commission, 2026). This compares to a 2019 base of approximately 12,845,900 nonfarm jobs — an increase of 11.2% in total employment. Texas reached a new record-high civilian labor force of 15,879,000 in late 2025.
The U.S. Census Bureau's Vintage 2024 estimates place Texas population at 31,290,831 as of July 2024, up from 28,986,794 in 2019 — a gain of 2.3 million residents (7.9%) (U.S. Census Bureau, 2025a). The Census Bureau reported that in 2024, Princeton, Texas — a Dallas suburb — was the fastest-growing city in the entire United States with a 30.6% single-year growth rate (U.S. Census Bureau, 2025b). These structural factors — 2.3 million new consumers, 1.4 million new workers — continuously expand the transaction base regardless of price levels.
Part III: The Complete Comparative Picture
The table below synthesizes all primary-source economic data into a single comparative view, distinguishing nominal growth (which includes inflation) from real growth (which measures actual volume expansion):
| Indicator | 2019 Value | 2024 Value | Nominal Growth | Real Growth (2019$) |
|---|---|---|---|---|
| U.S. CPI-U (Index) | 255.7 | 313.7 | — | +22.7% (inflation) |
| DFW CPI-U (Index) | 237.6 | 299.0 | — | +25.8% (inflation) |
| TX Real GDP | $1.807T | $2.222T | +46.6% nominal | +23.0% |
| TX Sales Tax Revenue | $34.02B | $47.16B | +38.6% | +13.0% |
| TX Statewide Taxable Sales | $556.9B | $768.0B | +37.9% | +12.4% |
| TX Nonfarm Employment | 12.846M | 14.287M | — | +11.2% |
| TX Population | 28.987M | 31.291M | — | +7.9% |
| TX Property Tax Levy | $66.5B | $86.6B | +30.1% | — |
Sources: BEA via FRED (TXRGSP); TX Comptroller BRE 2026-27; TX Comptroller Quarterly Sales Tax Historical Data; TWC nonfarm employment; U.S. Census Bureau QuickFacts Texas; TX Policy Research property tax levy data.
Every single real measure expanded. There is no indicator in this table — GDP, taxable sales, employment, population — that contracted over the five-year period despite cumulative price inflation of 22.7–25.8%. The Texas economy did not merely survive the worst inflation in 40 years; it grew robustly through it in volume terms.
Part IV: Why the 5% Rate Specifically Does Not Threaten Economic Activity
The Rate Is Already Embedded in Texas Consumer Behavior
Texas currently imposes a combined maximum sales tax rate of 8.25% (6.25% state + 2.0% local) (Texas Comptroller of Public Accounts, 2026c). Most major Texas cities, including Cedar Hill at 8.125%, already operate at or near this combined rate. The proposal to apply a 5% flat rate on all transactions — including currently exempt categories — represents a rate reduction for currently taxable transactions from 8.25% to 5.0%, a decrease of 3.25 percentage points. For consumers buying a television or appliance, the proposed flat rate actually lowers their tax burden.
The 5% Rate as a Natural Experiment Benchmark
The inflation data provides a natural experiment: an exogenous price shock applied uniformly across all goods and services. The proposed 5% flat rate, by contrast:
- Applies only to items currently exempt (for items already taxed, the rate effectively decreases)
- Is offset by the elimination of property taxes, returning purchasing power through a different channel
- Is permanent and predictable — businesses and consumers can plan around it
- Applies at a rate of 5.0% vs. the 25.8% cumulative price shock already absorbed
Under the natural experiment provided by 2019–2024, consumers absorbed price increases of 25.8% in DFW and responded by expanding real taxable sales volumes by 12.4% and supporting real GDP growth of 23.0%. The "treatment" (inflation) was 5.2 times larger than the proposed policy change (5% tax). If the treatment produced no economic contraction, the policy change cannot logically be expected to produce contraction either.
The Property Tax Elimination Offset
The critics' framing systematically ignores the other side of the ledger. The flat sales tax does not simply impose a new cost — it replaces an existing, growing, and economically more destructive tax: the property tax.
The Texas Comptroller's data shows total Texas property tax levies reached $86.597 billion in 2024, having grown 30.1% from $66.545 billion in 2019 — outpacing even nominal GDP growth (Texas Policy Research, 2025; Texans for Fiscal Responsibility, 2025). Property taxes function as a recurring wealth tax that:
- Cannot be deferred or avoided (failure to pay results in property loss)
- Increases annually regardless of the owner's income or cash flow
- Applies to businesses and residential property alike, raising input costs across the economy
- Averaged approximately $8,058 per Texas household in 2024
The Texas Comptroller's FY2025 Tax Exemptions and Tax Incidence Report confirms that the food sales tax exemption is worth approximately $4.30 billion in foregone revenue, implying a $68.8 billion food retail base (Texas Comptroller of Public Accounts, 2025c). At a 5% rate, the new annual tax cost on groceries per household would be approximately $320 — against a property tax savings of approximately $8,058 per household. The net household financial impact is strongly positive for the average Texas family.
FY2025 and FY2026 Continuity: The Current Trend Supports the Thesis
The economic resilience observed through the 2021–2023 inflation period has continued into FY2025 and early FY2026. Acting Comptroller Hancock announced that FY2025 state sales tax revenue totaled $49.06 billion, up 4.0% from FY2024 — exceeding the approximate 2.7% inflation rate for real growth of approximately 1.3% (Texas Comptroller of Public Accounts, 2025b). In January 2026, monthly collections totaled $4.6 billion, up 7.1% year-over-year — "well above the rate of general price inflation" (Texas Comptroller of Public Accounts, 2026a). This is a consistent, sustained pattern confirming the Texas economy continues to expand in real terms.
Part V: Answering the Volatility Argument — A Decade of Data Shows Structural Stability
Beyond the argument that a sales tax suppresses economic activity, critics raise a second structural objection: that sales tax revenue is inherently volatile — prone to sharp swings during recessions that would leave Texas unable to meet its obligations if it depended on sales taxes to replace property taxes. The argument has surface appeal, but the official 10-year revenue record and a comparison with how property taxes actually behave during downturns decisively answer it.
The Volatility Claim: What Critics Actually Say
The Texas Comptroller's own 2016 Fiscal Notes analysis formally assessed the relative volatility of Texas tax streams, assigning a volatility index value to each. On that index, a score of zero would represent a perfectly stable tax. Oil and gas production taxes scored 45.9 — reflecting extreme sensitivity to global commodity markets. The general sales tax scored 6.8 — making it the most stable of the major transaction-based taxes and comparable in stability to motor fuels taxes (Texas Comptroller of Public Accounts, 2016). The Pew Charitable Trusts' 2025 national analysis independently confirmed this, reporting a 15-year (FY2009–FY2023) volatility score of 5.2 for general sales taxes — the lowest among major state tax streams — versus far higher scores for personal income taxes and corporate income taxes (Pew Charitable Trusts, 2025).
This means the critics' framing is structurally wrong from the outset: sales taxes are not the volatile alternative to property taxes — they are among the least volatile major tax instruments available to state and local governments.
Ten Years of Texas Sales Tax Data: The Official Record
The Texas Comptroller's Biennial Revenue Estimate 2026-27 provides a complete annual history of state sales tax collections going back to FY1996. The following table presents the official 10-year record from FY2015 through FY2025, including both economic shock events (an oil price collapse in FY2016 and the COVID-19 pandemic in FY2020) and the post-pandemic recovery and inflation surge (Texas Comptroller of Public Accounts, 2025a):
| Fiscal Year | State Sales Tax Revenue | YoY Change | Economic Context |
|---|---|---|---|
| 2015 | $28.911 billion | +5.6% | Baseline; oil prices beginning to fall |
| 2016 | $28.246 billion | −2.3% | Oil price collapse (WTI avg. ~$43/barrel) |
| 2017 | $28.900 billion | +2.3% | Recovery from oil collapse |
| 2018 | $31.937 billion | +10.5% | Strong expansion |
| 2019 | $34.024 billion | +6.5% | Pre-COVID baseline |
| 2020 | $34.099 billion | +0.2% | COVID-19 pandemic — essentially flat for full fiscal year |
| 2021 | $36.020 billion | +5.6% | Post-pandemic recovery begins |
| 2022 | $42.972 billion | +19.3% | Inflation surge + pent-up demand |
| 2023 | $46.581 billion | +8.4% | Continued expansion |
| 2024 | $47.160 billion | +1.2% | Normalization |
| 2025 (actual) | $49.060 billion | +4.0% | Above-inflation real growth |
| 10-Year CAGR (FY2015–FY2025) | +5.43% per year | Total growth: +$20.15B (+69.7%) | ||
Source: Texas Comptroller of Public Accounts (2025a). Biennial Revenue Estimate 2026-27: Sales Taxes and Total Tax Collections. https://comptroller.texas.gov/about/media-center/infographics/2025/bre26-27/collections.php — FY2025 actual from Texas Comptroller of Public Accounts (2025b).
The 10-year record shows exactly one year of negative growth across a decade that included both a significant oil-price-driven contraction and a global pandemic: FY2016 at −2.3%, driven by the collapse of the oil and gas sector and its associated equipment spending (Texas Comptroller of Public Accounts, 2016). Every other year produced positive collections. The 10-year compound annual growth rate of 5.43% is virtually identical to the Comptroller's reported 29-year average annual growth rate of 5.4% (FY1996–FY2024), meaning no structural deviation has occurred even across extraordinary economic events (Texas Comptroller of Public Accounts, 2025a).
The COVID-19 Test: The Ultimate Stress Case
The COVID-19 pandemic is the critics' strongest possible argument for volatility risk — the most sudden and severe economic shock in modern memory. The Federal Reserve Bank of Dallas called it "the steepest and fastest drop in Texas economic activity in modern history" (Dallas Federal Reserve, 2020). How did Texas sales tax revenue actually perform?
This counter-intuitive result has a clear explanation. Texas's fiscal year runs September 1 through August 31. The first half of FY2020 (September 2019 – February 2020) was performing 5.6% ahead of the prior year when COVID hit in March 2020. The second half of FY2020 saw sales tax collections fall 4.7% vs. the prior year — but the strong first half entirely offset the recession-half decline, producing a flat full-year result (Federal Reserve Bank of Dallas, 2020). By July 2020, monthly collections had already returned to positive year-over-year territory: $2.98 billion, up 4.3% from July 2019, a mere four months into the pandemic (Texas Comptroller of Public Accounts, 2020). By FY2021, collections grew +5.6%, and by FY2022 they surged +19.3% as pent-up demand and inflation combined to produce the largest single-year gain in at least a generation (Texas Comptroller of Public Accounts, 2025a).
Compare this to the behavior of other Texas revenue sources during COVID. The Dallas Federal Reserve's analysis showed that while sales tax collections declined moderately in the second half of FY2020, oil production taxes, hotel occupancy taxes, and motor vehicle sales taxes collapsed far more severely. The total state tax revenue decline was over $3 billion in the second half of FY2020 — but sales tax losses accounted for only $816 million (about one-quarter) of that total, with far more volatile taxes making up the remaining three-quarters (Federal Reserve Bank of Dallas, 2020). This is directly consistent with the Comptroller's formal volatility scoring: the general sales tax was never the fragile revenue source — it was the anchor of stability amid the collapse of the more volatile taxes.
Comparing the Great Recession: The Worst Historical Scenario
For the worst-case historical benchmark, the Comptroller's own research on recessions and revenue provides the authoritative numbers. The Great Recession produced the most significant sales tax decline in Texas in at least four decades: collections fell an average of 9.5% over 14 consecutive months from February 2009 to March 2010, with a peak single-month decline of 14.5% in November 2009 (Texas Comptroller of Public Accounts, 2020). In annual fiscal year terms, the BRE data shows the revenue impact as follows:
| Fiscal Year | State Sales Tax Revenue | YoY Change | Context |
|---|---|---|---|
| 2008 | $21.604 billion | +6.6% | Pre-recession peak |
| 2009 | $21.014 billion | −2.7% | Great Recession begins in Texas |
| 2010 | $19.630 billion | −6.6% | Recession trough |
| 2011 | $21.479 billion | +9.4% | Recovery — returns to pre-recession level |
| 2012 | $24.191 billion | +12.6% | Full recovery and new record |
Source: Texas Comptroller of Public Accounts (2025a). BRE 2026-27: Sales Taxes and Total Tax Collections.
The Great Recession produced a cumulative two-year sales tax decline of approximately $1.97 billion from the FY2008 peak — representing a trough-to-peak decline of about 9.1% over two years. By FY2012, collections had not only fully recovered but exceeded the FY2008 peak by 11.9%, achieving a new record. Total recovery time from trough to new record: two years (Texas Comptroller of Public Accounts, 2025a).
Texas Policy Research's analysis of recession impact on total state revenue provides the broader context: the Great Recession caused the largest overall revenue decline in modern Texas history — 8.5% in the first year and 6.5% in the second. Even under this worst-case scenario, the analysis found that Texas's Economic Stabilization Fund could absorb a revenue shortfall of up to $11 billion (Texas Policy Foundation, 2023). The ESF today stands at $24.28 billion (FY2025) and is projected to reach $27.43 billion by FY2026 — the largest state rainy day fund in the country — specifically sized to absorb exactly the type of short-term revenue dip that would occur in any future recession (Texas Comptroller of Public Accounts, 2025c).
The Property Tax "Stability" Myth
The critics' implicit premise is that property taxes are more stable than sales taxes and therefore preferable as a revenue foundation. This premise deserves direct examination, because the academic and official record reveals that property tax "stability" is largely a lagged accounting artifact rather than genuine economic stability.
The Federal Reserve Board's research on property taxes and the housing crisis found that property tax revenues appear stable during downturns specifically because of two structural lags: (1) significant delays between market value changes and taxable assessment updates, and (2) the propensity of local governments to increase tax rates when property values fall, in order to maintain revenue — effectively transferring the economic shock onto property owners who are already financially stressed (Federal Reserve Board, 2010). The Lincoln Institute of Land Policy's analysis of Texas specifically confirmed this pattern: the elasticity between property tax base changes and tax levies is approximately 0.57, meaning policymakers systematically offset value declines by raising rates — preventing revenue loss but increasing the burden on property owners during their most financially vulnerable periods (Lincoln Institute of Land Policy, 2025).
In practical terms: during the Great Recession, while Texas sales tax collections fell 9.1% over two years (a visible, measurable, and temporary decline), property tax rates were quietly raised to prevent levy declines — meaning homeowners facing job loss, reduced income, and declining home values simultaneously faced higher property tax bills. The "stability" of property tax revenue was maintained not by economic resilience but by involuntary extraction from struggling households. Sales tax revenue, by contrast, fell because people spent less — and then automatically recovered as spending recovered. The burden adjusted with the economy; property tax burdens did not.
The Structural Response: Texas's Rainy Day Fund Is Built for Sales Tax Cycles
Texas has built a purpose-specific institutional mechanism to manage the short-term cyclicality of sales-tax-dependent revenue: the Economic Stabilization Fund (ESF), commonly called the Rainy Day Fund. The ESF was created by constitutional amendment in 1988 precisely because Texas recognized that its major revenue sources (then dominated by oil and gas taxes) could be cyclical, and the state needed a structural buffer. Today, with a balance of $24.28 billion in FY2025 — projected to reach $27.43 billion by FY2026 — the ESF represents the largest rainy day fund of any U.S. state, equivalent to 65.8 days of state government operations (Texas Comptroller of Public Accounts, 2025c; Pew Charitable Trusts, 2025).
Under a broadened flat-rate sales tax structure that replaces property taxes, the same ESF mechanism would continue to function as the cyclical buffer. A revenue shortfall during a recession — drawing down the ESF temporarily — is operationally and constitutionally analogous to exactly the scenario the ESF was designed and sized to handle. The Comptroller's own analysis confirms that the fund is already projected to remain above its constitutional cap through at least FY2035, generating approximately $1 billion per year in investment income alone (Texas Comptroller of Public Accounts, 2025c).
The Comparative Stability Scorecard
| Criterion | Property Tax | Flat 5% Sales Tax |
|---|---|---|
| Official volatility score (TX Comptroller, 2016) | Not formally scored (local government revenue) | 6.8 (one of lowest among major TX taxes) |
| Pew national 15-yr volatility score for general sales taxes | Lower (for state-level property taxes) | 5.2 — lowest of all major state tax streams |
| Full-year impact of COVID-19 pandemic | +3.8% (local property tax levies grew during pandemic) | +0.2% (essentially flat state sales tax) |
| Maximum 2-year recession decline (Great Recession) | Minimal — but achieved by raising rates on struggling households | −9.1% cumulative, fully recovered in 2 years |
| Recovery speed after recession | Slow — rate cuts lag recovery by years | Immediate — follows economic activity in real time |
| Adjustment mechanism during downturns | Rate increases imposed on struggling property owners | Spending falls naturally; ESF absorbs budget gap |
| 10-year CAGR (TX sales tax FY2015–FY2025) | +8.6% avg (levy growth — faster than economy) | +5.43% (tracks economic activity) |
| Rainy day fund buffer available | N/A — property tax rate can always be raised | $24.28B ESF (12× the worst-ever recession shortfall) |
| Long-run growth 29-yr average (TX sales tax) | N/A | +5.4% per year (FY1996–FY2024) |
Sources: Texas Comptroller of Public Accounts (2016). Tax Volatility, Fiscal Notes; Pew Charitable Trusts (2025). State Tax Revenue Is Becoming More Volatile; Texas Comptroller of Public Accounts (2025a, 2025c); Texas Policy Research (2025); Federal Reserve Bank of Dallas (2020); Lincoln Institute of Land Policy (2025).
The data tells a consistent story: sales tax revenue is not more volatile than property tax revenue in any meaningful practical sense, and where short-term cyclicality does occur, Texas has specifically sized its Economic Stabilization Fund to absorb it. The "stability" of property taxes during recessions is achieved by raising rates on struggling households — the opposite of what a consumption-based tax does. A sales tax that falls during a recession is self-adjusting; a property tax that stays flat or rises during a recession is a burden that cannot be escaped.
Part VI: Summary Master Analysis Table
| Indicator | Value | Implication |
|---|---|---|
| THE INFLATION SHOCK (2019–2024) | ||
| Cumulative U.S. CPI increase | +22.7% | Across all goods/services, involuntary |
| Cumulative DFW CPI increase | +25.8% | Across all goods/services, involuntary |
| Peak single-year YoY inflation | +9.1% (June 2022) | Largest since 1981 |
| DFW single-year food inflation (2022) | +12.2% nationally | Direct consumer food cost shock |
| THE PROPOSED POLICY CHANGE | ||
| Flat sales tax rate proposed | 5.0% | On currently exempt items only; rate decreases on currently taxable items |
| Inflation vs. proposed 5% tax ratio | 5.2× (DFW) / 4.5× (US) | Inflation was far larger than proposed tax |
| TEXAS ECONOMIC RESPONSE TO INFLATION | ||
| Texas real GDP growth (2019–2024) | +23.0% | Real output, inflation-stripped |
| Texas real taxable sales growth | +12.4% | Volume of transactions, inflation-stripped |
| Texas real sales tax revenue growth | +13.0% | Real purchasing-power-adjusted collections |
| Texas nonfarm job creation (2019–2024) | +1.44 million jobs | Structural economic expansion |
| Texas population growth (2019–2024) | +2.30 million | Expanding consumer base |
| THE PROPERTY TAX CONTEXT | ||
| Total TX property tax levy (2024) | $86.597 billion | The burden being eliminated |
| Property tax levy growth (2019–2024) | +30.1% | $20.1B increase in 5 years, faster than inflation |
| Estimated annual food tax per household | ~$320/yr | At 5% on $68.8B food base |
| Average property tax per household | ~$8,058/yr | Based on total levy ÷ 10.75M households |
| Net household benefit | ~$7,738/yr savings | Property tax eliminated > new consumption tax cost |
Conclusion: The Data Answers the Critics
The evidentiary record is complete and consistent. Texas consumers and businesses absorbed a cumulative price increase of 22.7–25.8% between 2019 and 2024 — with the peak single year reaching 9.1% nationally, larger than the proposed flat tax rate itself — and responded by expanding real economic output by 23.0%, real taxable sales volumes by 12.4%, and creating 1.44 million new jobs.
The critics' argument that a 5% flat sales tax would suppress economic activity asks Texans to believe that a price adjustment of 5% on a subset of transactions — offset by the elimination of an $86.6 billion property tax burden — will produce economic effects that a 25.8% cumulative price increase applied to all transactions did not produce. The data from five consecutive years of official primary-source records does not support that conclusion.
The Texas economy is structurally resilient: it is growing through inflation, through interest rate increases, through policy uncertainty, and through global disruption. A flat, predictable, transparent 5% consumption tax — one that replaces the most economically destructive recurring tax in the state and releases the average household from $8,058 in annual property tax obligations — cannot be logically expected to produce the outcome the critics fear when far larger price shocks produced the opposite.
Annotated Bibliography
APA 7th Edition
Bureau of Economic Analysis via Federal Reserve Bank of St. Louis (FRED). (2025, September 26). Real Gross Domestic Product: All Industry Total in Texas (TXRGSP), millions of chained 2017 dollars, not seasonally adjusted, annual 1997–2024. Federal Reserve Bank of St. Louis. https://fred.stlouisfed.org/series/TXRGSP
Official BEA annual real GDP data for Texas in chained 2017 dollars. Used to calculate real GDP growth of 23.0% from $1.807T (2019) to $2.222T (2024). Primary source for all real GDP figures in this article.
Federal Reserve Bank of Boston. (2026, January 21). Why has consumer spending remained so resilient? Evidence from credit card data. https://www.bostonfed.org/publications/current-policy-perspectives/2025/why-has-consumer-spending-remained-resilient.aspx
Federal Reserve research documenting that real aggregate consumer spending remained resilient despite elevated interest rates and inflation since 2022. Provides national-level confirmation of the Texas-specific resilience findings.
Office of the Texas Governor. (2025, March 30). Texas economy grows faster than nation in 4th quarter of 2024 [Press release]. https://gov.texas.gov/news/post/texas-economy-grows-faster-than-nation-in-4th-quarter-of-2024
Official Texas Governor's press release citing BEA data showing Texas real GDP growth of 3.5% vs. national 2.4% in Q4 2024, confirming continued outperformance.
Texas Comptroller of Public Accounts. (2025a, January). Biennial Revenue Estimate 2026-27: Sales taxes and total tax collections [Infographic]. https://comptroller.texas.gov/about/media-center/infographics/2025/bre26-27/collections.php
Official Comptroller historical table showing annual state sales tax revenue from FY2019 ($34.024B) through FY2024 ($47.160B), used to calculate nominal growth of 38.6% and real growth of 13.0%.
Texas Comptroller of Public Accounts. (2025b, September 3). Acting Comptroller Kelly Hancock announces state revenue for fiscal year 2025 [Press release]. https://comptroller.texas.gov/about/media-center/news/20250903-...
Official FY2025 year-end revenue announcement: sales tax revenue $49.06 billion (+4.0% over FY2024), confirming continued real economic expansion above inflation rate.
Texas Comptroller of Public Accounts. (2025c, January 17). Texas Comptroller Glenn Hegar releases Tax Exemptions and Tax Incidence Report [Press release]. https://comptroller.texas.gov/about/media-center/news/20250117-...
Official source for sales tax exemptions in FY2025: food for home consumption ($4.30B foregone), OTC drugs ($1.08B), total aggregate exemptions ($98.14B). Used in consumer food tax base and per-household analysis.
Texas Comptroller of Public Accounts. (2025d, December 1). State sales tax revenue totaled $4.5 billion in November [Press release]. https://comptroller.texas.gov/about/media-center/news/20251201-...
Monthly revenue announcement confirming continued real growth above inflation rate, part of the sustained pattern into FY2026.
Texas Comptroller of Public Accounts. (2025e, November 3). State sales tax revenue totaled $4.2 billion in October [Press release]. https://comptroller.texas.gov/about/media-center/news/20251103-...
Official monthly announcement with Acting Comptroller Hancock's statement: "Overall, state sales tax collections grew faster than general price inflation. This reflects a Texas economy that continues to expand at a moderate pace."
Texas Comptroller of Public Accounts. (2026a, February 2). State sales tax revenue totaled $4.6 billion in January [Press release]. https://comptroller.texas.gov/about/media-center/news/20260202-...
Official monthly revenue announcement for January 2026: $4.6 billion, +7.1% YoY, with Acting Comptroller's statement that growth was "well above the rate of general price inflation."
Texas Comptroller of Public Accounts. (2026b). Quarterly Sales Tax Historical Data: Statewide Grand Totals, All Industries, 2019–2025. https://mycpa.cpa.state.tx.us/allocation/HistSales
Official Comptroller transaction-level data for statewide taxable sales ($556.9B in 2019 → $768.0B in 2024). Primary quantitative source for real taxable sales growth of 12.4% after inflation adjustment.
Texas Comptroller of Public Accounts. (2026c). Sales and Use Tax. https://comptroller.texas.gov/taxes/sales/
Official Comptroller reference for the Texas combined maximum sales tax rate of 8.25% (6.25% state + 2.0% local), used to establish the current consumer tax environment.
Texas Policy Research. (2025, September 20). Texas property tax levies 1998–2024 [Data table citing Texas Comptroller annual property tax levy records]. https://www.texaspolicyresearch.com/texas-property-tax-levies-1998-2024/
Compiled annual property tax levy data from the Texas Comptroller covering all taxing entities from 1998–2024. Used for the 2019 ($66.545B) and 2024 ($86.597B) total levy figures and the 30.1% growth calculation.
Texans for Fiscal Responsibility. (2025, January 19). Property taxes up again in 2024. https://texastaxpayers.com/property-taxes-up-again-in-2024/
Analysis of Comptroller data confirming the 2024 total property tax levy increase. Secondary source confirming Texas Policy Research levy figures, with breakdown by entity type.
Texas Workforce Commission. (2026, January 8). Texas labor force surpasses 15.9 million as nonfarm job count increases [Press release]. https://www.twc.texas.gov/news/texas-labor-force-surpasses-159-million-nonfarm-job-count-increases
Official TWC nonfarm employment report confirming 14,321,000 total nonfarm jobs and record labor force of 15,879,000. Used to document the +11.2% employment expansion through the inflation period.
U.S. Bureau of Labor Statistics. (2022, July 18). Consumer prices up 9.1 percent over the year ended June 2022, largest increase in 40 years. U.S. Department of Labor. https://www.bls.gov/opub/ted/2022/consumer-prices-up-9-1-percent-over-the-year-ended-june-2022-largest-increase-in-40-years.htm
Official BLS documentation of the June 2022 peak 9.1% YoY inflation rate, food inflation (+10.4%), and energy inflation (+41.6%). Primary source for the peak inflation benchmark throughout this article.
U.S. Bureau of Labor Statistics. (2023, October 3). Consumer spending increased 9.0 percent in 2022. U.S. Department of Labor. https://www.bls.gov/opub/ted/2023/consumer-spending-increased-9-0-percent-in-2022.htm
Official BLS Consumer Expenditure Survey data showing aggregate U.S. consumer spending increased 9.0% in 2022 despite 9.1% inflation — directly demonstrating that peak inflation did not suppress spending.
U.S. Bureau of Labor Statistics. (2026a, February). Consumer Price Index Historical Tables for U.S. City Average: CPI-U, all items, 1982–84=100, not seasonally adjusted. U.S. Department of Labor. https://www.bls.gov/regions/mid-atlantic/data/consumerpriceindexhistorical_us_table.htm
Official BLS CPI-U monthly index values used to compute annual averages and cumulative inflation of 22.7% (2019–2024). Applied as deflators for all nominal-to-real conversions.
U.S. Bureau of Labor Statistics. (2026b, February). Consumer Price Index, Dallas-Fort Worth-Arlington area, bimonthly, all items, not seasonally adjusted. U.S. Department of Labor. https://www.bls.gov/regions/southwest/news-release/consumerpriceindex_dallasfortworth.htm
Official BLS regional CPI data for DFW. Used to establish cumulative local inflation of 25.8% (2019–2024), the most relevant geographic benchmark for Texas consumer price experience.
U.S. Census Bureau. (2025a, May 15). Population growth reported across cities and towns in all U.S. regions [Press release, Vintage 2024 estimates]. https://www.census.gov/newsroom/press-releases/2025/vintage-2024-popest.html
Official Census Bureau Vintage 2024 population estimates confirming Texas population of 31,290,831 (July 2024), used to calculate 7.9% population growth from 28,986,794 in 2019.
U.S. Census Bureau. (2025b). QuickFacts: Texas. https://www.census.gov/quickfacts/fact/table/TX/PST040224
Official Census QuickFacts data for Texas providing household count, population, and demographic breakdowns used in per-household calculations throughout the article.