
Healthcare vs. War Spending - Republicans Voted for More Healthcare
Healthcare vs. War Spending: What the Federal Ledger Actually Shows
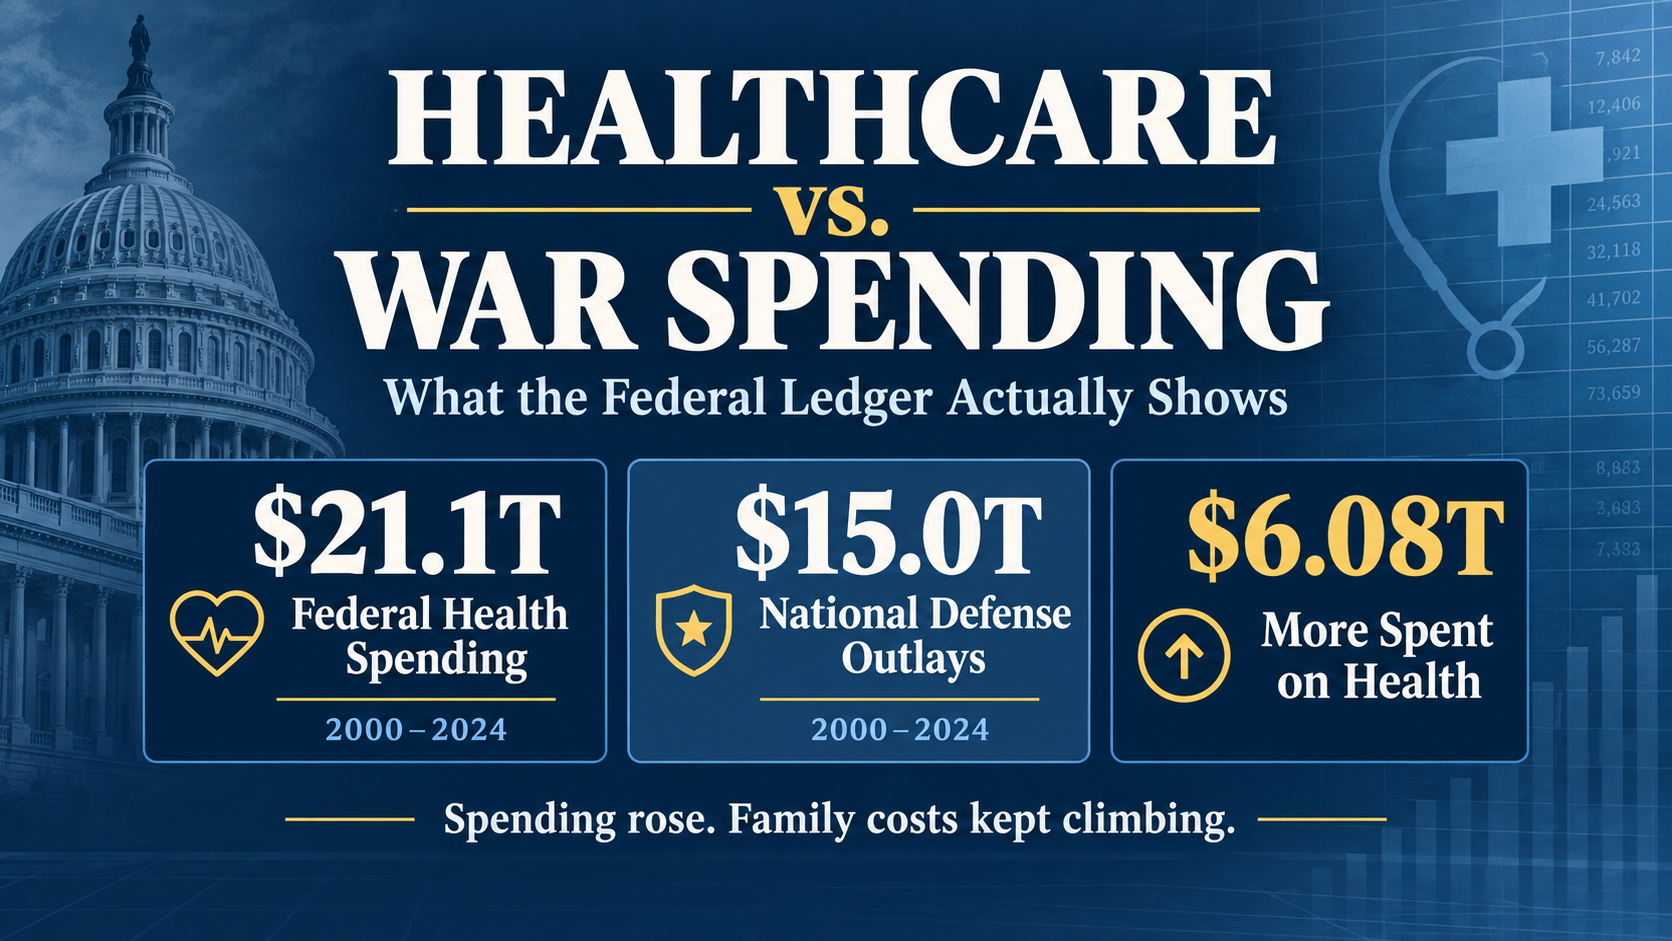
Texas Democrats argue that Washington finds money for wars but not for healthcare. The federal ledger says the opposite: since 2000 the United States has spent $6.08 trillion more on healthcare than on national defense — including under Republican control. Yet family premiums, deductibles, and out-of-pocket costs kept climbing. The spending happened. The savings did not.
The claim, in their own words
The argument is that Washington always finds money to bomb people overseas but never enough for Americans’ healthcare. It is a specific, testable factual claim.
James Talarico, the Democratic nominee for the U.S. Senate in Texas, has made this argument the centerpiece of his fiscal case. In a national television interview he framed it around a community that sits just outside this district:
“I was in Sand Branch, Texas, which is a community south of Dallas that doesn’t have running water. It doesn’t have basic sewer infrastructure. So, every dollar we spend bombing people in the Middle East is a dollar we’re not spending in Sand Branch, Texas, or in our communities here at home. We’re always told that we don’t have enough money for schools or for health care or for our veterans, but there’s always enough money to bomb people on the other side of the world.”James Talarico, CBS Mornings interview, March 9, 2026 (Talarico, 2026a)
He has repeated the formulation in his own posts — “I wish they would fund healthcare like they fund forever wars in the Middle East” (Talarico, 2026b) — and built it into his deficit plan, promising to close the deficit partly by “ending forever wars that send billions of our tax dollars overseas.” (Talarico, 2026c) His veterans platform pledges to “oppose forever wars like the one in Iran,” (Talarico, 2026d) and his healthcare platform calls for a federal buy-in program he calls “Medicare for Y’all.” (Talarico, 2026f) (Talarico, 2026e)
The same construction appears at the national level. Rep. Jasmine Crockett wrote that “people can’t afford groceries and millions are losing healthcare, but this is where his focus is” while describing a new war. (Crockett, 2026) A Democratic National Committee release said Republicans want to “slash even more health care funding for working families to pay for their war with Iran” after promising to stop “endless wars.” (Democratic National Committee, 2026)
A search of Rep. Aicha Davis’s campaign site, X timeline, and Texas House member pages found no statement of any kind linking war or military spending to healthcare funding. Her Texas House media and newsletter pages carry no releases. (Texas House of Representatives, n.d.) Her healthcare record is domestic: she told the Dallas Morning News voter guide that “I absolutely believe Texas should expand Medicaid eligibility,” (Davis, 2024) and she has said Texans need “more jobs, more healthcare, higher wages, and to cut costs at the gas pump, grocery store, and pharmacy.” (Davis, 2025) Her campaign site states in the third person that she “supports a federal Medicare for All plan.” (Davis for Texas, n.d.) This article therefore tests the war-versus-healthcare argument as made by Talarico, Crockett, and the DNC — not as a claim attributed to Rep. Davis.
National accounts can test whether federal health spending was small relative to military spending, and whether household costs fell while public spending rose. They cannot prove that one spending category caused a specific price or health outcome. Timing, correlation, and a legislative marker are not a causal design, and nothing below is presented as one.
Two propositions are on the table. First: that Washington chose war over healthcare. Second: that more federal healthcare spending is the remedy for what Americans pay. The first proposition does not survive the federal ledger. The second is not supported by twenty-five years of evidence.
The federal ledger: healthcare won, and it was not close
From 2000 through 2024, federal health spending exceeded total national-defense outlays by $6.08 trillion.
CMS reports $21.087 trillion in cumulative federal health spending from 2000 through 2024. OMB reports $15.004 trillion in national-defense outlays over the same numbered years — a figure that includes every ship, salary, base, and weapons program, not just the wars. Federal health spending was 40.5% larger. (CMS, 2024) (OMB, 2026)
The war-specific number is smaller still. Overseas Contingency Operations and Global War on Terror budget authority totaled $1.973 trillion across 2001–2022. Federal health spending over 2000–2024 was roughly 10.7 times that amount. The two measures cover different spans and different budget concepts, so the ratio is a scale comparison rather than an accounting identity. (U.S. Government Accountability Office, 2019)
OCO/GWOT is measured as budget authority, not outlays, and it is a subset of the national-defense function. Adding it to OMB defense outlays would double count part of the military total. This article never does that, and any analysis that does should be treated with suspicion. (U.S. Government Accountability Office, 2019)
This was not a partisan choice
The pattern does not depend on which party held power. In 2017–2018, with a Republican president and Republican majorities in both the House and Senate, federal health spending totaled $2.036 trillion against $1.230 trillion in defense outlays — a ratio of 1.65 to 1, higher than the full-period average. (CMS, 2024) (OMB, 2026) (U.S. House of Representatives, n.d.) (U.S. Senate, n.d.)
Republicans did not merely tolerate this spending. House Republicans voted 219–7 to create the Children’s Health Insurance Program in 1997, and Medicare Part D — the largest entitlement expansion between Medicare’s creation and the Affordable Care Act — passed in 2003 with only 25 Republicans opposed in the House. Republican-supported increases in federal health spending far exceed anything spent on the wars.
Per person, after inflation, the gap is even wider
Adjusting for prices and population removes the two easiest objections to the raw totals.
Nominal dollars invite a fair challenge: prices rose and the country grew. Both controls make the case stronger, not weaker. Deflating to 2000 dollars with the CPI-U and dividing by resident population, real federal health spending rose from $932 per person in 2000 to $2,666 in 2024 — a 186% real increase. Real per-person defense spending rose from $1,042 to $1,410, a 35% increase, after peaking at $1,767 in 2010 at the height of the Iraq and Afghanistan commitments. (CMS, 2024) (OMB, 2026)
By 2024 the federal government was spending $1.89 on healthcare for every $1.00 it spent on national defense, per American, in inflation-adjusted dollars. In 2000 that ratio was $0.89. The country did not choose war over healthcare. It moved decisively in the opposite direction.
All that spending did not lower what families pay
Premiums, worker contributions, deductibles, and direct out-of-pocket costs all rose faster than inflation.
If federal healthcare spending reduced the cost of healthcare, the household ledger should show it. It does not. AHRQ’s employer-insurance survey shows that from 2000 to 2024 the average family premium rose 262.3% nominally and 98.9% after inflation. The employee’s share of a family premium rose 347.1% nominally and 145.4% in real terms. The average individual deductible rose from $446 in 2002 to $2,085 in 2024, a 168.0% real increase. (AHRQ, 2026)
KFF’s independent employer survey points the same direction from a different sample: family premiums rose from $6,415 in 2000 to $25,586 in 2024, and workers’ family-premium contributions rose from $1,625 to $6,366. (KFF, 2025) The two surveys use different methods and should not be averaged together, but they agree on direction and magnitude.
Direct out-of-pocket spending tells the same story. CMS records a rise from $197.6 billion in 2000 to $556.6 billion in 2024. After adjusting for inflation and population that is an increase from $700 to $898 per person in 2000 dollars — 28.4% higher even as the federal government took on a far larger share of national health spending. (CMS, 2024)
Underneath those totals, prices themselves diverged sharply. From January 2000 to July 2026 the hospital-services index rose 292.6%, medical-care services 151.9%, prescription drugs 95.7%, and physicians’ services 83.0%. (BLS, 2026) A single “healthcare inflation” number hides the fact that hospital pricing, not drugs, is the fastest-growing measured component.
They told us this would fix it. Here is what they said.
Every major expansion arrived with an explicit promise about costs. Twenty-four years later, the promises are testable — and the answer is the same every time.
The argument for the next expansion is always the same as the argument for the last one: cover more people, spend more federal money, and costs will come down. That argument has now been made, funded, and enacted repeatedly, by both parties, across a quarter century. It deserves to be graded against its own stated goals rather than against a caricature. So here are the goals, in the words of the people who set them, from their own official transcripts and agency fact sheets.
The Affordable Care Act
Announcing his plan to a joint session of Congress, President Obama set out three goals, the third of which was explicitly about cost:
“The plan I’m announcing tonight would meet three basic goals. It will provide more security and stability to those who have health insurance. It will provide insurance for those who don’t. And it will slow the growth of health care costs for our families, our businesses, and our government.”President Barack Obama, address to a joint session of Congress, September 9, 2009 (Obama, 2009a)
Four days before enactment he was more specific about price: Americans “buying comparable coverage in the individual market would end up seeing their premiums go down 14 to 20 percent.” (Obama, 2010a) At the signing he made the broadest claim of all — that the law “will also lower costs for families and for businesses and for the federal government, reducing our deficit by over $1 trillion in the next two decades.” (Obama, 2010b)
Congressional leadership said the same. Senate Majority Leader Harry Reid told the Senate the bill would cut the deficit “by $130 billion in the first 10 years” and that “we do this by keeping costs down.” (Reid, 2009) On the House floor the day of final passage, Rep. Robert Andrews said that for “a family making $45,000 a year, if you look at their premiums, their copays and their deductibles … the bill saves them $7,000 a year,” and Texas Rep. Gene Green said the bills would introduce “competition that will drive premiums down.” (Congressional Record, 2010)
The American Rescue Plan and the Inflation Reduction Act
The 2021 expansion was sold the same way. CMS announced that Marketplace “premiums after these new savings will decrease, on average, by $50 per person per month or by $85 per policy per month.” (CMS, 2021) In 2022, CMS said the Inflation Reduction Act was “delivering on his promise to lower prescription drug costs, make health insurance more affordable, and make the economy work for working families,” (CMS, 2022) and the White House stated flatly that the law “will lower health care costs, including prescription drug costs.” (The White House, 2022)
The ARPA and IRA Marketplace claims describe what a subsidized enrollee pays after federal tax credits — not the insurer’s full premium and not the total national cost. Both things can be true at once: an enrollee’s monthly bill falls while the underlying price and the federal outlay both rise. That is cost shifting, and it is a real benefit to that household. It is not the same as making healthcare cheaper, and it should not be described as if it were.
This is not a partisan indictment
Republicans made the identical kind of promise. Signing Medicare Part D in 2003, President George W. Bush said that “in return for a monthly premium of about $35, most seniors without any prescription drug coverage can now expect to see their current drug bills cut roughly in half.” (Bush, 2003) The pattern being described here is not one party’s failure. It is a structural failure of the theory that more federal money buys lower healthcare prices.
So what actually happened?
Take 2010, the year the ACA was signed, as the baseline and measure everything after inflation. Every burden the law was meant to relieve went up.
In real dollars, between 2010 and 2024 the average employer family premium rose 23%, the worker’s share of that premium rose 34.8%, and the average individual deductible rose 41.3%. (AHRQ, 2026) Direct out-of-pocket spending per person rose 16.2%, and federal health spending per person rose 41.4%. (CMS, 2024) Over the same fourteen years the hospital-services price index rose 79.3% and medical-care services rose 48.9% in nominal terms. (BLS, 2026) Costs did not fall. Their growth did not stop. The federal government simply became a much larger payer inside a market that kept getting more expensive.
Even the official forecasts missed badly — in both directions
Honesty requires reporting this fully, because it cuts both ways. CBO projected in March 2010 that 92% of people under 65 would have coverage in 2016; its own retrospective reports 90% of the total population insured that year, while explicitly flagging that the two figures cover different populations. (Congressional Budget Office, 2017) CBO also found its 2010 subsidy estimates were 14% above actual for 2014–2015 and 43% above actual for 2016. (Congressional Budget Office, 2017) CMS’s Office of the Actuary projected 2019 national health expenditures of $4.717 trillion; the actual figure was about $3.8 trillion. (CMS Office of the Actuary, n.d.) Its September 2010 projection put 2019 spending at 19.6% of GDP with 92.7% of Americans insured; the outcomes were 17.7% and 90.3%. (CMS Office of the Actuary, 2010)
National spending came in below the official projection, and coverage came in below it too. A forecast miss is not a policy effect. The 2010-to-2019 difference absorbs a recession and recovery, changed utilization, later legislation, court decisions, administrative choices, and revised forecasting methods — none of which can be untangled from the law itself using these numbers. What the misses do establish is that the projections attached to a healthcare bill are not reliable enough to justify a trillion-dollar commitment on their own. That is a reason for sunset clauses and measured targets, not for a bigger check.
The question that has not been answered
Coverage expanded. CHIP reauthorization was promised to “continue coverage for seven million children” and cover four million more, and coverage did expand. (Obama, 2009b) Millions gained insurance under the ACA. Those are real accomplishments, and pretending otherwise would be dishonest.
But the cost promise — the one that was made every single time, by both parties, to justify every expansion — has not been kept once in twenty-four years. Premiums rose. Worker contributions rose faster. Deductibles rose fastest of all. Out-of-pocket spending rose. Federal spending per person nearly tripled across the full period. So when the next proposal arrives arguing that the way to fix rising healthcare costs is another expansion of federal healthcare spending, the burden of proof has shifted. The theory has been tested at a scale of $21 trillion. It did not work.
If more federal healthcare spending lowers what Americans pay for healthcare, then twenty-four years of the largest healthcare expansions in American history — SCHIP, Medicare Part D, the ACA, CARES, ARPA, and the IRA — should have lowered it. Instead every household cost measure rose in real terms. Anyone arguing for the next expansion owes voters an explanation of what will be different this time, stated as a number, with a date, and a consequence if it is missed.
Every major law, every vote, and what followed
Nine major spending laws. None of them ended the cost problem.
The record of major federal and Texas healthcare-spending legislation since 1997 shows a consistent pattern in the votes and an equally consistent pattern in the aftermath. Coverage expansions under unified Democratic control — the Affordable Care Act, the American Rescue Plan, the Inflation Reduction Act — passed on near-perfect party-line votes with no Republican support in either chamber. Bills passed under divided or Republican-led government drew broad bipartisan majorities.
| Legislation | Signed | Effective | House yeas | House nays | Senate yeas | Senate nays |
|---|---|---|---|---|---|---|
| Balanced Budget Act of 1997 (created SCHIP/CHIP) | 1997-08-05 | 1997-10-01 | 270 | 162 | 85 | 15 |
| Medicare Prescription Drug, Improvement, and Modernization Act (created Medicare Part D) | 2003-12-08 | 2006-01-01 | 220 | 215 | 54 | 44 |
| Children's Health Insurance Program Reauthorization Act of 2009 | 2009-02-04 | 2009-04-01 | 289 | 139 | 66 | 32 |
| Patient Protection and Affordable Care Act (ACA) | 2010-03-23 | 2010-09-23 (initial provisions); 2014-01-01 (Medicaid expansion & individual mandate/marketplaces) | 219 | 212 | 60 | 39 |
| Coronavirus Aid, Relief, and Economic Security Act (CARES Act) | 2020-03-27 | 2020-03-27 | — | — | 96 | 0 |
| American Rescue Plan Act of 2021 (ARPA) | 2021-03-11 | 2021-03-11 (with ACA subsidy enhancements retroactive to 2021 tax year) | 220 | 211 | 50 | 49 |
| Inflation Reduction Act of 2022 (Medicare drug price negotiation, insulin cap) | 2022-08-16 | 2022-10-01 (rebate baseline); 2023-01-01 (insulin cap, vaccine cost-sharing elimination); 2026-01-01 (drug price negotiation) | 220 | 207 | 51 | 50 |
| House Bill 12 - Texas Medicaid/CHIP Postpartum Coverage Extension (2 months to 12 months) | 2023-06 (Signed by Gov. Abbott) | 2024-03-01 (CMS approval implementation) / statutory effective 2023-09-01 | 132 | 8 | 31 | 0 |
| Texas House Amendment to SB 30 to Expand Medicaid under ACA (FAILED) | N/A - not enacted | N/A - not enacted | 65 | 83 | — | — |
What matters here is not any single law. It is that the enactment and effective dates of all of them are visible on the spending chart in Section 2, and none of them produced a durable break in the cost trend. Medical price inflation was already elevated two years before Medicare Part D was signed. No statistically significant cost or spending spike appears around the ACA’s passage or its 2014 coverage expansion. The single largest spending spike in the entire dataset — 2020 — arrived alongside a pandemic, so that year reflects an emergency as much as any statute.
Across twenty-five years and nine major laws, no examined statute permanently ended the growth of U.S. healthcare prices or total health expenditures. Every law arrived, took effect, and the cost line kept climbing. Section 7 examines how closely that cost line tracked federal spending across the whole period.
Spending and costs moved together — and we have never tested the other direction
Our own analysis of the assembled datasets. Twelve independent cost measures, one federal spending series, twenty-five years.
Everything to this point has been descriptive: spending went up, costs went up. The obvious next question is how closely those two things actually tracked each other. So we tested it directly against the data we downloaded from CMS, OMB, BLS, and AHRQ, rather than relying on anyone else’s characterization of the relationship.
We took federal health spending as one series and tested it against twelve separate cost measures drawn from four independent federal data systems: total national health expenditures, NHE per capita, out-of-pocket spending, the medical care CPI and four of its components, employer family and single premiums, the worker’s contribution, and the individual deductible. These are not variations on one number. They come from different agencies, different collection methods, and different parts of the healthcare economy.
Result one: every single measure moved with federal spending
All twelve cost measures returned a correlation with federal health spending of 0.94 or higher in annual levels, with a median of 0.974. There were no exceptions, no weak cases, and no measure that broke the pattern. Rank correlation — which only asks whether the two series move in the same order regardless of magnitude — came in between 0.98 and 0.997 for every measure.
Any two series that both climb for twenty-five years will correlate highly, so a 0.97 on its own proves very little. We are reporting it because all twelve did it, with no exception, and because the direction test below does not depend on the shared trend at all. Anyone who cites a level correlation like this as evidence of a mechanism is overreaching, and this article does not.
Result two: they rose together in nine of every ten years
The stronger test ignores levels entirely and asks a simpler question: in each year, did federal spending and the cost measure move in the same direction? Across the twelve measures, federal spending and the cost series moved the same way in 81% to 92% of all year pairs. For most measures the figure is 91.7% — twenty-two of twenty-four years.
Result three: the magnitudes are not proportional
This is where a careless version of the argument would go wrong, so we state it plainly. The two sides did not rise by the same amount. Federal health spending grew 527.7% over the period, a compound rate of 7.95% a year. The cost measures grew far less in most cases: total national health expenditures 286.7%, the medical care CPI 116.2%, physicians’ services 70.8%. Only the measures that fall directly on households kept pace — the worker’s family contribution grew 347.1% and the individual deductible 367.4%.
So the relationship is directional and consistent, not proportional. Federal spending grew faster than nearly every cost measure it is compared against. What tracked federal spending most closely in magnitude was not the price of care but the share of that price landing on the worker.
Result four: year to year, the coupling is loose
Honesty requires this one too. When we compare annual growth rates rather than direction, the relationship weakens considerably. Growth-rate correlations range from 0.665 for NHE per capita down to 0.065 for physicians’ services, and out-of-pocket spending is actually negative at −0.567 — in the years federal spending accelerated hardest, direct out-of-pocket spending decelerated, which is what payer substitution looks like. The tight pattern lives in the long-run trend and in the direction of travel, not in the year-to-year wiggle.
Independent lead-lag work on this same question reached a compatible result: the strongest association appears in the same year rather than at any consistent lag, at 0.415 for the medical CPI and 0.665 for NHE per capita, with no stable relationship at one, two, or three years in either direction. That analysis is included in the data tabs below as a cross-check on our own numbers.
The finding nobody has tested
Here is what we could not analyze, and why it matters more than anything above.
Across twenty-four year-over-year comparisons, nominal federal health spending declined in exactly two years — 2011 and 2021 — and the largest single-year decline in the entire record was 1.70%. Adjusted for inflation and population it fell in five years, never by more than 6.5%, and never twice in a row for longer than two years. Over the same period, total national health expenditures, the medical care CPI, and employer family premiums never declined in a single year. Not once in twenty-four observations.
| Series | Years compared | Years with an increase | Years with a decrease | Share of years increasing (%) | Decrease years | Largest single-year decrease (%) | Median annual change (%) |
|---|---|---|---|---|---|---|---|
| Federal health spending, nominal | 24 | 22 | 2 | 91.7 | 2011, 2021 | -1.7 | 6.22 |
| Federal health spending, real (2000$) | 24 | 19 | 5 | 79.2 | 2011, 2012, 2021, 2022, 2023 | -6.1 | 3.88 |
| Federal health spending, real per person | 24 | 19 | 5 | 79.2 | 2011, 2012, 2021, 2022, 2023 | -6.5 | 3.21 |
| Total national health expenditures | 24 | 24 | 0 | 100.0 | none | — | 5.15 |
| CPI medical care index | 24 | 24 | 0 | 100.0 | none | — | 3.54 |
| Employer family premium | 23 | 23 | 0 | 100.0 | none | — | 5.52 |
| Out-of-pocket spending (total) | 24 | 22 | 2 | 91.7 | 2009, 2020 | -1.93 | 4.37 |
We have twenty-five years of evidence about what happens to healthcare costs when federal healthcare spending goes up. Costs went up too, in nine of every ten years, across every measure, without exception. We have essentially zero evidence about what happens when federal healthcare spending goes down — because it has never meaningfully gone down. The largest reduction in the entire record is 1.7% in a single year. No sustained reduction has ever been attempted, so the downward half of this relationship has never been observed even once.
That is a remarkable gap in the policy record. Every proposal for twenty-five years has moved the same lever in the same direction, and every time the cost measures moved with it. The one experiment that has never been run is the one that would actually test the theory — and it is the one nobody in Washington proposes. When a relationship is this consistent in one direction across twelve independent measures, the refusal to examine the other direction stops looking like caution and starts looking like an unwillingness to find out.
That federal health spending and every measured healthcare cost rose together, in the same direction, in the overwhelming majority of years on record, across twelve independent measures from four separate federal data systems. That the magnitudes were not proportional and the year-to-year coupling was loose. And that the downward direction has never been observed. It does not claim that one caused the other. It claims that the pattern is real, uniform, documented in the government’s own data, and that half of it has never been tested.
Did Americans get healthier?
The honest answer is mixed — and the mixed answer is more useful than a slogan.
Some outcomes improved substantially. Life expectancy rose from 76.8 years in 2000 to 79.0 in 2024, despite collapsing to 76.4 in 2021 during the pandemic. (National Center for Health Statistics, 2021) (Xu et al., 2026) Age-adjusted heart-disease mortality fell 38.8% and cancer mortality fell 30.2% over the same period. (National Center for Health Statistics, 2026) (Xu et al., 2026) Those are real gains, and any argument that pretends otherwise will not survive a hostile fact-check.
Other indicators moved the wrong way, and they are the indicators that drive future spending. Adult obesity rose from 30.5% in 1999–2000 to 40.3% in August 2021–August 2023, and severe obesity more than doubled from 4.7% to 9.7%. (Fryar et al., 2024) Total adult diabetes prevalence rose from 9.7% to 14.3%. (Shin et al., 2024) Age-adjusted drug-overdose mortality rose from 6.1 per 100,000 in 1999 to 23.1 in 2024 — nearly four times higher — even after a sharp improvement from 31.3 in 2023. (Garnett & Miniño, 2026)
A 186% real increase in per-person federal health spending bought 2.2 additional years of life expectancy, major reductions in heart-disease and cancer mortality, a 10-point rise in obesity prevalence, a 4.6-point rise in diabetes prevalence, and a near-quadrupling of overdose mortality. That is not a failure of medicine. It is a value question — and value questions are answered with accountability, not with more money.
What the evidence supports
Three conclusions the data will carry, and two they will not.
Supported. First, the United States did not choose war over healthcare. Federal health spending exceeded total national-defense outlays by $6.08 trillion across 2000–2024, exceeded documented war funding by roughly eleven to one, and did so under Republican control as well as Democratic. (CMS, 2024) (OMB, 2026) Second, no major law in the record permanently ended healthcare cost growth; premiums, worker contributions, deductibles, and out-of-pocket costs all rose in real terms while federal spending nearly tripled per person. (AHRQ, 2026) (KFF, 2025) Third, health outcomes improved in some dimensions and deteriorated badly in others, so the return on that spending is genuinely open to question.
Observed but unexplained. Federal health spending and every measured healthcare cost rose together, in the same direction, in roughly nine of every ten years on record. What we cannot report is the other half of that relationship, because it has never been observed: federal health spending has never undergone a sustained multi-year reduction in this period, so there is no evidence at all about what happens to costs when it falls. That gap is not a limitation of the data. It is a limitation of the policy record.
A test for any future proposal
- Define the outcome. Lower premiums, lower out-of-pocket costs, longer life, and disease-specific improvement are four different targets with four different measures.
- Match the measure. Do not compare budget authority with outlays, out-of-pocket spending with premiums, or survey-cycle prevalence with annual death rates.
- Publish the counterfactual. State what would plausibly happen without the policy and how that will be measured.
- Separate timing from causation. A cost change after a law is a lead for investigation, never proof of effect.
- Name the sunset. If the program does not hit its stated target by a stated date, it should end or change.
“There’s always enough money to bomb people on the other side of the world.” The federal ledger says there was $6.08 trillion more for healthcare than for the entire national-defense function — and Americans still paid more out of pocket every year.— The record, 2000–2024
The war-versus-healthcare argument is emotionally effective and factually wrong. We already spend far more on healthcare than on the military, and twenty-five years of rising spending has not lowered what a family in Cedar Hill, DeSoto, Lancaster, or Seagoville pays for coverage. The answer is not another trillion dollars with no accountability attached. It is price transparency, real competition, payment reform, prevention of the chronic diseases that drive the bills, and an honest measurement standard applied to every dollar before it is spent.
References
Sources are organized by the sections they principally inform. Every entry links to the original source and explains how it was used. No aggregator, encyclopedia, or fact-checking site was used as a primary source.
Political statements — Section 1
Crockett, J. [@RepJasmine]. (2026, January 3). Trump promised no “new stupid wars,” yet he’s starting one with Venezuela without congressional approval [Post]. X. https://x.com/RepJasmine/status/2007452040444731475
The original post by a prominent Texas Democrat, quoted in full rather than excerpted. It directly juxtaposes a new war with household affordability and loss of healthcare, establishing the argument this article tests.
Davis, A. (2024, February). Candidate questionnaire, Texas House District 109. Dallas Morning News Voter Guide. https://voterguide.dallasnews.com/2024-primary/candidates/3822/
The candidate’s own written answers published verbatim, including a direct response on Medicaid expansion. Used to characterize her stated healthcare position accurately and to document that it does not include a war-spending comparison.
Davis, A. (2025, October 16). Statement on the 89th legislative session. Texas Metro News. https://texasmetronews.com/101064/best-in-class-davis-authors-numerous-bills/
A first-person end-of-session statement reproduced in full. It is her most recent published healthcare framing and contains no military-spending comparison.
Davis for Texas. (n.d.). On the issues. https://www.davisfortexas.com/on-the-issues
Official campaign copy, written in the third person. It is cited as an attributable campaign position rather than as a direct quotation, and it states support for a federal Medicare for All plan.
Democratic National Committee. (2026, March 30). Trump and Republicans want to make even more cuts to health care to pay for their war of choice with Iran. https://democrats.org/new-trump-and-republicans-want-to-make-even-more-cuts-to-health-care-to-pay-for-their-war-of-choice-with-iran/
The official party release containing the explicit “endless wars” and healthcare-funding tradeoff language evaluated here. Used to document the party’s stated argument, never as evidence for its factual premises.
Talarico, J. (2026a, March 9). Post-primary interview [Video]. CBS Mornings. https://www.youtube.com/watch?v=43bV4rvXYUc
The complete original broadcast interview on CBS’s own channel, not an aggregator clip. The quotation is presented with the surrounding sentences so it cannot be read as decontextualized. Wording was transcribed from the video’s caption track and should be re-verified against the timestamp before republication.
Talarico, J. [@jamestalarico]. (2026b, September 3). I wish they would fund healthcare like they fund forever wars in the Middle East [Post]. X. https://x.com/jamestalarico/status/2095639408183517645
The candidate’s own post, read directly at its permalink. It is the most compact statement of the war-versus-healthcare framing and is quoted with its adjacent lines intact.
Talarico, J. (2026c, August 5). A new American dream [Video]. Arlington, TX policy address. https://www.youtube.com/watch?v=GK24thp_2Qo
The full policy address posted on the candidate’s own channel, establishing that ending “forever wars” is a stated component of his deficit-reduction plan rather than an offhand remark. Caption-derived transcription; verify before republication.
Talarico, J. (2026d, August 20). How I’ll serve our veterans. Substack. https://jamestalarico.substack.com/p/how-ill-serve-our-veterans
A self-published written platform document, which avoids any transcription question. It confirms opposition to “forever wars like the one in Iran” as an explicit campaign position.
Talarico, J. (2026e). Health care. James Talarico for Senate. https://jamestalarico.com/issue/health-care/
The official campaign healthcare platform, used to state his healthcare position in his campaign’s own words rather than through a third-party characterization.
Talarico, J. (2026f, February 4). Candidate questionnaire: Texas Democrats running for U.S. Senate. The Texas Tribune. https://www.texastribune.org/2026/02/04/on-the-issues-a-qa-with-the-texas-democrats-running-for-u-s-senate/
The candidate’s own written answers published in full. Used for his “Medicare for Y’all” proposal in his own words rather than a paraphrase.
Texas House of Representatives. (n.d.). District 109 member media. https://house.texas.gov/members/4465/media
The official member page, checked to confirm that no official press releases or newsletters exist to quote. This documents the absence finding stated in Section 1 rather than leaving it as an assertion.
Stated promises and official projections — Section 5
Bush, G. W. (2003, December 8). Remarks on signing the Medicare Prescription Drug, Improvement, and Modernization Act of 2003. The White House. https://georgewbush-whitehouse.archives.gov/news/releases/2003/12/20031208-1.html
The official signing transcript for Medicare Part D, included deliberately so the promise pattern is documented for a Republican expansion as well as Democratic ones. The claim that drug bills would be “cut roughly in half” applied to seniors then lacking coverage under the benefit design projected for 2006.
Centers for Medicare & Medicaid Services. (2021, March 12). The American Rescue Plan and the Marketplace [Fact sheet]. https://www.cms.gov/newsroom/fact-sheets/american-rescue-plan-and-marketplace
The official agency description of ARPA’s Marketplace subsidy expansion, including the $50-per-person and $85-per-policy monthly figures. These are net premiums after federal tax credits, not gross premiums, and the article states that distinction where the figures are used.
Centers for Medicare & Medicaid Services. (2022, October 5). Inflation Reduction Act lowers health care costs for millions of Americans [Fact sheet]. https://www.cms.gov/newsroom/fact-sheets/inflation-reduction-act-lowers-health-care-costs-millions-americans
The official post-enactment statement of what the IRA was expected to deliver, including Medicare negotiation, the $2,000 Part D cap in 2025, and continued Marketplace subsidies. Used to document the stated promise, with implementation dates noted.
CMS Office of the Actuary. (2010, September). National health expenditure projections 2009–2019. https://www.cms.gov/files/document/nheprojections2009to2019pdf
The official actuarial projection issued shortly after enactment, supplying the 19.6%-of-GDP and 92.7%-insured figures for 2019 that are compared with measured outcomes. The projection already incorporated the ACA.
CMS Office of the Actuary. (n.d.). Projections revision analysis. https://www.cms.gov/files/document/projectionsrevisionanalysispdf
The agency’s own analysis of how its national health expenditure forecasts were revised, identifying the April 2010 projection of $4.717 trillion for 2019 against a roughly $3.8 trillion actual. The document does not characterize that gap as ACA-caused savings, and neither does this article.
Congressional Budget Office. (2014). Updated estimates of the effects of the insurance coverage provisions of the Affordable Care Act. https://www.cbo.gov/publication/45447
CBO’s official record of its ACA coverage and budget estimates. It is cited to establish what was projected at the time; CBO has explained that no clean ex-post actual deficit effect is available, so none is reported here.
Congressional Budget Office. (2017). How CBO’s estimates of the effects of the Affordable Care Act have changed over time. https://www.cbo.gov/publication/53094
CBO’s own retrospective on its ACA forecasting accuracy, supplying the coverage-share comparison and the finding that 2010 subsidy estimates ran 14% above actual for 2014–2015 and 43% above actual for 2016. CBO flags a population-scope mismatch in the coverage comparison, which this article repeats rather than suppresses.
Obama, B. (2009a, September 9). Address to a joint session of Congress on health insurance reform. The White House. https://obamawhitehouse.archives.gov/video/president-obama-address-to-congress-on-health-insurance-reform/index__q_page=109.html
The archived official record of the address that set out the plan’s three goals, the third being to slow the growth of healthcare costs. This is the clearest statement of the stated cost objective against which the law can be graded.
Obama, B. (2009b, February 4). Remarks on the Children’s Health Insurance Program bill signing. The White House. https://obamawhitehouse.archives.gov/the-press-office/remarks-president-barack-obama-childrenrsquos-health-insurance-program-bill-signing
The official signing transcript containing the coverage commitment for CHIP reauthorization. Note that the archived page metadata can display an incorrect September date; the transcript heading and event identify February 4, 2009.
Obama, B. (2010a, March 19). Remarks by the President on health insurance reform in Fairfax, Virginia. The White House. https://obamawhitehouse.archives.gov/the-press-office/remarks-president-health-insurance-reform-fairfax-virginia
The official transcript containing the 14-to-20-percent premium claim. The claim was expressly scoped to comparable coverage in the individual market, and the article states that qualifier rather than applying the number to the employer market.
Obama, B. (2010b, March 23). Remarks by the President and Vice President at signing of the health insurance reform bill. The White House. https://obamawhitehouse.archives.gov/the-press-office/remarks-president-and-vice-president-signing-health-insurance-reform-bill
The official bill-signing transcript containing the broadest cost claim — lower costs for families, businesses, and the federal government — which is not scoped to any single market and is therefore the fair standard for the household-cost test in Section 5.
Reid, H. (2009, November 19). Senate floor statement on health care reform. Congressional Record, 155(172), S11515. https://www.congress.gov/congressional-record/volume-155/issue-172/senate-section/article/S11515-7
The official Congressional Record text of the Majority Leader’s deficit and cost-containment claims, quoted directly from the government record rather than from any news account.
U.S. Congress. (2010, March 21). Congressional Record, House proceedings. https://www.congress.gov/crec/2010/03/21/CREC-2010-03-21.pdf
The official record of House floor debate on the day of final passage, supplying the Andrews $7,000-savings claim and Rep. Gene Green’s statement that competition would drive premiums down. Both are quoted in full context from the government record.
The White House. (2009, May 11). Coming together, bringing down costs. https://obamawhitehouse.archives.gov/blog/2009/05/11/coming-together-bringing-down-costs
An official administration post describing a health-sector coalition commitment that “could result in savings of roughly $2,500 for American families.” It is included with the explicit caveat that it is not the widely repeated campaign premium pledge, is not stated per year, and does not describe an enacted bill.
The White House. (2022, August 16). Fact sheet: How the Inflation Reduction Act helps Black communities. https://www.whitehouse.gov/briefing-room/statements-releases/2022/08/16/fact-sheet-how-the-inflation-reduction-act-helps-black-communities/
An official signing-day statement that the IRA “will lower health care costs, including prescription drug costs.” Used to document the stated claim; the underlying provisions carry implementation dates running through 2026.
Federal spending and prices — Sections 2 through 7
Agency for Healthcare Research and Quality. (2026). Medical Expenditure Panel Survey—Insurance Component data tools. https://datatools.ahrq.gov/meps-ic/
The official federal employer-insurance survey, supplying national private-sector premiums, employee contributions, and deductibles. Employer contributions were computed as total premium minus employee contribution. The survey was not fielded in 2007 and no value was imputed for that year.
Centers for Medicare & Medicaid Services. (2024). National health expenditure accounts: Historical. https://www.cms.gov/data-research/statistics-trends-and-reports/national-health-expenditure-data/historical
The official source for national health spending by payer and sponsor. It supplies the federal health series used in the cumulative comparison and the out-of-pocket series used in the household analysis. Sponsor spending is calendar-year and is not directly reconcilable line by line with fiscal-year budget outlays.
KFF. (2025). 2025 employer health benefits survey. https://www.kff.org/health-costs/2025-employer-health-benefits-survey/
An independent employer survey used strictly as a cross-check on the federal MEPS-IC series. The two are never merged or averaged because their samples and methods differ.
Office of Management and Budget. (2026). Historical tables. https://www.whitehouse.gov/omb/information-resources/budget/historical-tables/
The official federal budget history, supplying national-defense outlays by fiscal year. This is the broadest defense measure available and is deliberately used in place of a narrower war-only figure so the comparison is unfavorable to this article’s own thesis.
U.S. Bureau of Labor Statistics. (2026). CPI-U medical care flat file [Dataset]. https://download.bls.gov/pub/time.series/cu/cu.data.15.USMedical
The official monthly price file containing medical-care and component indexes. It supports the component-price chart and the deflation of all real-dollar series. The seasonally adjusted health-insurance identifier is absent from this file; the available series is not seasonally adjusted and begins in December 2005.
U.S. Government Accountability Office. (2019). Overseas contingency operations: Alternatives identified to the approach to fund war-related activities. https://www.gao.gov/products/gao-19-211
A federal audit explaining the scope and accounting of war-designated funding. It supports the guardrail that OCO budget authority is a narrower concept than outlays and must never be added to total defense.
U.S. House of Representatives, Office of the Historian. (n.d.). Party divisions of the House of Representatives, 1789 to present. https://history.house.gov/Institution/Party-Divisions/Party-Divisions/
The official party-division table documenting chamber control during the 115th Congress. Used only to establish the political-control context for the 2017–2018 comparison.
U.S. Senate Historical Office. (n.d.). Party division. https://www.senate.gov/history/partydiv.htm
The Senate’s official historical record of party control, complementing the House source for the same limited purpose.
Health outcomes — Section 8
Fryar, C. D., Carroll, M. D., & Afful, J. (2024). Prevalence of overweight, obesity, and severe obesity among adults age 20 and older: United States, 1960–1962 through August 2021–August 2023. National Center for Health Statistics. https://www.cdc.gov/nchs/data/hestat/hestat111.htm
The official NHANES analysis providing age-adjusted obesity and severe-obesity estimates by survey cycle. These are multi-year cycles, not annual observations, and were used without interpolation.
Garnett, M. F., & Miniño, A. M. (2026). Drug overdose deaths in the United States, 2023–2024. National Center for Health Statistics. https://www.cdc.gov/nchs/products/databriefs/db549.htm
Final 2024 overdose mortality with a consistent 2014–2024 trend table, used to extend the CDC data-portal series through 2024 including the sharp 2024 improvement.
National Center for Health Statistics. (2026). Age-adjusted death rates for selected major causes of death [Dataset]. https://data.cdc.gov/resource/6rkc-nb2q
The national dataset supplying long-run age-adjusted mortality for heart disease and cancer. Annual NCHS mortality briefs extend those series to 2024.
National Center for Health Statistics. (2021). Life expectancy at birth, age 65, and age 75, by sex, race, and Hispanic origin: United States, selected years 1900–2019 [Dataset]. https://ftp.cdc.gov/pub/Health_Statistics/NCHS/Publications/Health_US/hus20-21tables/lexpmort.xlsx
The official historical workbook supplying annual life-expectancy values through 2019, joined to annual NCHS mortality briefs for 2020–2024 without interpolation.
Shin, J. I., et al. (2024). Prevalence of total, diagnosed, and undiagnosed diabetes in adults: United States, August 2021–August 2023. National Center for Health Statistics. https://www.cdc.gov/nchs/products/databriefs/db516.htm
The official NHANES report supplying total, diagnosed, and undiagnosed diabetes prevalence with historical comparison cycles from 1999–2000 forward.
Xu, J., Murphy, S. L., Kochanek, K. D., & Arias, E. (2026). Mortality in the United States, 2024. National Center for Health Statistics. https://www.cdc.gov/nchs/products/databriefs/db548.htm
The final 2024 mortality report providing life expectancy and age-adjusted rates for leading causes of death, supplying the endpoint values used throughout Section 6.
Inspect the Data
Each tab pairs a reproducible visualization with the table behind it. Every chart is drawn in your browser from the same numbers you can download here or retrieve from the original source listed in the bibliography.
| Year | Federal health ($B) | Defense outlays ($B) | Cum. health ($B) | Cum. defense ($B) |
|---|---|---|---|---|
| 2000 | 263.2 | 294.4 | 263.2 | 294.4 |
| 2005 | 456.5 | 495.3 | 2,202.3 | 2,303.4 |
| 2010 | 739.8 | 693.5 | 5,257.9 | 5,347.0 |
| 2015 | 917.0 | 589.7 | 9,255.8 | 8,557.0 |
| 2020 | 1,511.8 | 724.6 | 14,873.9 | 11,790.6 |
| 2024 | 1,652.0 | 873.5 | 21,087.3 | 15,004.0 |
| Year | Family premium | Employee family contribution | Single deductible |
|---|---|---|---|
| 2000 | $6,772 | $1,614 | — |
| 2005 | $10,728 | $2,585 | $652 |
| 2010 | $13,871 | $3,721 | $1,025 |
| 2015 | $17,322 | $4,710 | $1,541 |
| 2020 | $20,758 | $5,978 | $1,945 |
| 2024 | $24,540 | $7,216 | $2,085 |
| Year | Prescription drugs | Hospital services | Physicians services | Medical services | Medical commodities |
|---|---|---|---|---|---|
| 2000 | 100.0 | 100.0 | 100.0 | 100.0 | 100.0 |
| 2005 | 122.3 | 138.6 | 117.5 | 126.6 | 115.9 |
| 2010 | 142.9 | 191.5 | 135.4 | 154.6 | 132.2 |
| 2015 | 167.9 | 240.0 | 149.6 | 179.0 | 148.9 |
| 2020 | 186.4 | 290.2 | 159.4 | 211.5 | 160.9 |
| 2024 | 195.1 | 343.3 | 170.8 | 230.2 | 173.4 |
| 2026 | 196.2 | 377.8 | 178.8 | 244.4 | 173.3 |
| Year | Life expectancy | Heart disease rate | Cancer rate | Diabetes rate | Overdose rate |
|---|---|---|---|---|---|
| 2000 | 76.8 | 257.6 | 199.6 | 25.1 | 6.2 |
| 2005 | 77.6 | 216.8 | 185.1 | 24.9 | 10.1 |
| 2010 | 78.7 | 179.1 | 172.8 | 20.8 | 12.3 |
| 2015 | 78.7 | 168.5 | 158.5 | 21.3 | 16.3 |
| 2020 | 77.0 | 168.2 | 144.1 | 24.8 | 28.3 |
| 2021 | 76.4 | 173.8 | 146.6 | 25.4 | 32.4 |
| 2024 | 79.0 | 157.6 | 139.4 | 21.7 | 23.1 |
| Legislation | Signed | Effective | House yeas | House nays | Senate yeas | Senate nays |
|---|---|---|---|---|---|---|
| Balanced Budget Act of 1997 (created SCHIP/CHIP) | 1997-08-05 | 1997-10-01 | 270 | 162 | 85 | 15 |
| Medicare Prescription Drug, Improvement, and Modernization Act (created Medicare Part D) | 2003-12-08 | 2006-01-01 | 220 | 215 | 54 | 44 |
| Children's Health Insurance Program Reauthorization Act of 2009 | 2009-02-04 | 2009-04-01 | 289 | 139 | 66 | 32 |
| Patient Protection and Affordable Care Act (ACA) | 2010-03-23 | 2010-09-23 (initial provisions); 2014-01-01 (Medicaid expansion & individual mandate/marketplaces) | 219 | 212 | 60 | 39 |
| Coronavirus Aid, Relief, and Economic Security Act (CARES Act) | 2020-03-27 | 2020-03-27 | — | — | 96 | 0 |
| American Rescue Plan Act of 2021 (ARPA) | 2021-03-11 | 2021-03-11 (with ACA subsidy enhancements retroactive to 2021 tax year) | 220 | 211 | 50 | 49 |
| Inflation Reduction Act of 2022 (Medicare drug price negotiation, insulin cap) | 2022-08-16 | 2022-10-01 (rebate baseline); 2023-01-01 (insulin cap, vaccine cost-sharing elimination); 2026-01-01 (drug price negotiation) | 220 | 207 | 51 | 50 |
| House Bill 12 - Texas Medicaid/CHIP Postpartum Coverage Extension (2 months to 12 months) | 2023-06 (Signed by Gov. Abbott) | 2024-03-01 (CMS approval implementation) / statutory effective 2023-09-01 | 132 | 8 | 31 | 0 |
| Texas House Amendment to SB 30 to Expand Medicaid under ACA (FAILED) | N/A - not enacted | N/A - not enacted | 65 | 83 | — | — |
| Speaker or agency | Date | Bill | Promise type | Stated promise (verbatim) |
|---|---|---|---|---|
| Barack Obama | 2009-09-09 | Affordable Care Act proposal | Slow cost growth | The plan I'm announcing tonight would meet three basic goals. It will provide more security and stability to those who have health insurance. It will provide insurance for those who don't. And it will slow the growth of health care costs for our families, our businesses, and our government. |
| Barack Obama | 2010-03-19 | Affordable Care Act | Lower premiums | Americans who are buying comparable coverage in the individual market would end up seeing their premiums go down 14 to 20 percent. |
| Barack Obama | 2010-03-23 | Affordable Care Act | Reduce the deficit | This legislation will also lower costs for families and for businesses and for the federal government, reducing our deficit by over $1 trillion in the next two decades. |
| Harry Reid | 2009-11-19 | Affordable Care Act proposal | Reduce the deficit | As the President asked us to do, this bill will not add a dime to the deficit--quite the opposite, in fact: It will cut it by $130 billion in the first 10 years and by as much as $3/4 trillion in the first 20 years. We do this by keeping costs down. |
| Robert Andrews | 2010-03-21 | Affordable Care Act and reconciliation bill | Lower premiums | We have heard someone say that the bill increases premiums for Americans. Section 1001 of the reconciliation bill says that for a family making $45,000 a year, if you look at their premiums, their copays and their deductibles, which is what real people have to do, the bill saves them $7,000 a year. |
| Gene Green | 2010-03-21 | Affordable Care Act and reconciliation bill | Lower premiums | H.R. 3590 and H.R. 4872 will rein in rising health costs for American families and small businesses—introducing competition that will drive premiums down, capping out-of-pocket spending. |
| Jesse Lee / Obama White House | 2009-05-11 | Pre-ACA health reform initiative | Slow cost growth | In short, the coalition has agreed to reduce the annual health care spending growth rate by 1.5 percentage points for the next 10 years, a change that could result in savings of roughly $2,500 for American families. |
| Centers for Medicare & Medicaid Services | 2021-03-12 | American Rescue Plan Act of 2021 | Lower premiums | Premiums after these new savings will decrease, on average, by $50 per person per month or by $85 per policy per month. Four out of five enrollees will be able find a plan for $10 or less/month after premium tax credits, and over 50% will be able to find a Silver plan for $10 or less. |
| Centers for Medicare & Medicaid Services | 2021-03-12 | American Rescue Plan Act of 2021 | Lower premiums | Individuals and families may be eligible for a temporary increase in premium tax credits for this year, with no one paying more than 8.5% of their household income towards the cost of the benchmark plan or a less expensive plan. |
| Centers for Medicare & Medicaid Services | 2022-10-05 | Inflation Reduction Act of 2022 | Lower drug prices | Through the Inflation Reduction Act, President Biden is delivering on his promise to lower prescription drug costs, make health insurance more affordable, and make the economy work for working families. This law means millions of Americans across all 50 states, the United States territories, and the District of Columbia will save money from meaningful benefits like: lower prescription drug prices in Medicare through price negotiation with manufacturers, a yearly cap ($2,000 in 2025) on out-of-pocket prescription drug costs in Medicare, and continued lower health insurance premiums through HealthCare.gov and the state-based Marketplaces. |
| The White House | 2022-08-16 | Inflation Reduction Act of 2022 | Lower health costs | The Inflation Reduction Act (IRA) will lower health care costs, including prescription drug costs, and expand health insurance coverage for Black families. |
| George W. Bush | 2003-12-08 | Medicare Prescription Drug, Improvement, and Modernization Act of 2003 (Part D) | Lower drug prices | In about two years, full prescription coverage under Medicare will begin. In return for a monthly premium of about $35, most seniors without any prescription drug coverage can now expect to see their current drug bills cut roughly in half. This new law will provide 95 percent coverage for out-of-pocket drug spending that exceeds $3,600 a year. |
| Barack Obama | 2009-02-04 | Children’s Health Insurance Program Reauthorization Act of 2009 | Expand coverage | That is why we have passed this legislation to continue coverage for seven million children, cover an additional four million children in need, and finally lift the ban on states providing insurance to legal immigrant children if they choose to do so. |
| Bill | Projected by | Metric | Projected | Actual | Actual year |
|---|---|---|---|---|---|
| Affordable Care Act | Congressional Budget Office and Joint Committee on Taxation | Federal deficit effect, 2010-2019 | $143 billion net deficit reduction (including $124 billion from health/revenue provisions and $19 billion from education provisions) | — | — |
| Affordable Care Act | Congressional Budget Office and Joint Committee on Taxation | Share of people under age 65 with health insurance in 2016 | 92% | 90% of the population had health insurance (not restricted to under age 65) | 2016 |
| Affordable Care Act | Congressional Budget Office and Joint Committee on Taxation | Identifiable ACA subsidies: newly eligible Medicaid plus Marketplace and Basic Health Program, 2014-2015 combined | 14% above the actual amount | — | 2014-2015 |
| Affordable Care Act | Congressional Budget Office and Joint Committee on Taxation | Identifiable ACA subsidies: newly eligible Medicaid plus Marketplace and Basic Health Program, 2016 | 43% above the actual amount | — | 2016 |
| Affordable Care Act | CMS Office of the Actuary | National Health Expenditures level in 2019 | $4.717 trillion | $3.8 trillion | 2019 |
| Affordable Care Act | CMS Office of the Actuary | National Health Expenditures as share of GDP in 2019 | 19.6% | 17.7% | 2019 |
| Affordable Care Act | CMS Office of the Actuary | Insured share of U.S. population in 2019 | 92.7% | 90.3% | 2019 |
build_comovement.py, included with this article.| Cost measure | Window | Level r | Rank rho | YoY growth r | Total growth (%) |
|---|---|---|---|---|---|
| Total national health expenditures | 2000-2024 | 0.991 | 0.997 | 0.662 | 286.7 |
| NHE per capita | 2000-2024 | 0.99 | 0.997 | 0.665 | 219.6 |
| CPI medical care (annual) | 2000-2024 | 0.973 | 0.997 | 0.415 | 116.2 |
| CPI medical care services | 2000-2024 | 0.975 | 0.995 | 0.409 | 130.2 |
| CPI hospital services | 2000-2024 | 0.974 | 0.997 | 0.255 | 243.3 |
| CPI prescription drugs | 2000-2024 | 0.939 | 0.995 | 0.145 | 95.1 |
| CPI physicians' services | 2000-2024 | 0.949 | 0.997 | 0.065 | 70.8 |
| Out-of-pocket spending (total) | 2000-2024 | 0.974 | 0.994 | -0.567 | 181.7 |
| Employer family premium | 2000-2024 | 0.97 | 0.997 | 0.116 | 262.3 |
| Employer single premium | 2000-2024 | 0.975 | 0.997 | 0.183 | 219.7 |
| Worker family contribution | 2000-2024 | 0.977 | 0.997 | 0.218 | 347.1 |
| Individual deductible | 2002-2024 | 0.938 | 0.983 | 0.106 | 367.4 |
| Cost measure | Year pairs | Both rose | Both fell | Moved opposite | Same direction (%) |
|---|---|---|---|---|---|
| Total national health expenditures | 24 | 22 | 0 | 2 | 91.7 |
| NHE per capita | 24 | 22 | 0 | 2 | 91.7 |
| CPI medical care (annual) | 24 | 22 | 0 | 2 | 91.7 |
| CPI medical care services | 24 | 21 | 0 | 3 | 87.5 |
| CPI hospital services | 24 | 22 | 0 | 2 | 91.7 |
| CPI prescription drugs | 24 | 21 | 1 | 2 | 91.7 |
| CPI physicians' services | 24 | 22 | 0 | 2 | 91.7 |
| Out-of-pocket spending (total) | 24 | 20 | 0 | 4 | 83.3 |
| Employer family premium | 23 | 21 | 0 | 2 | 91.3 |
| Employer single premium | 23 | 21 | 0 | 2 | 91.3 |
| Worker family contribution | 23 | 21 | 0 | 2 | 91.3 |
| Individual deductible | 21 | 17 | 0 | 4 | 81.0 |
| Measure | From | To | Total change (%) | Compound annual growth (%) |
|---|---|---|---|---|
| Federal health spending | 2000 | 2024 | 527.7 | 7.95 |
| Total national health expenditures | 2000 | 2024 | 286.7 | 5.8 |
| NHE per capita | 2000 | 2024 | 219.6 | 4.96 |
| CPI medical care (annual) | 2000 | 2024 | 116.2 | 3.27 |
| CPI medical care services | 2000 | 2024 | 130.2 | 3.54 |
| CPI hospital services | 2000 | 2024 | 243.3 | 5.27 |
| CPI prescription drugs | 2000 | 2024 | 95.1 | 2.82 |
| CPI physicians' services | 2000 | 2024 | 70.8 | 2.26 |
| Out-of-pocket spending (total) | 2000 | 2024 | 181.7 | 4.41 |
| Employer family premium | 2000 | 2024 | 262.3 | 5.51 |
| Employer single premium | 2000 | 2024 | 219.7 | 4.96 |
| Worker family contribution | 2000 | 2024 | 347.1 | 6.44 |
| Individual deductible | 2002 | 2024 | 367.4 | 7.26 |
| Lag (years) | Interpretation | r: fed spending vs medical CPI | r: fed spending vs NHE per capita |
|---|---|---|---|
| -3 | Cost leads FedSpend | 0.054 | 0.024 |
| -2 | Cost leads FedSpend | -0.024 | 0.083 |
| -1 | Cost leads FedSpend | 0.08 | -0.009 |
| 0 | Same year | 0.415 | 0.665 |
| 1 | FedSpend leads cost | -0.023 | 0.132 |
| 2 | FedSpend leads cost | 0.541 | -0.024 |
| 3 | FedSpend leads cost | -0.239 | 0.11 |