
Replacing Texas Property Taxes - Real Savings for Texas Families and Renters
Texas Property Tax Replacement Plan · Impact Analysis Series
Replacing Texas Property Taxes - Real Savings for Texas Families and Renters
A unified analysis of what Texas working families actually pay — through direct taxes, hidden business tax passthrough, and embedded costs in every price they see — and what changes on Day One under the Texas Property Tax Replacement Plan.
The Survival Floor
What the MIT Living Wage Calculator tells us it actually costs to live in Dallas County — before a single dollar of taxes.
Before we talk about taxes, we need to talk about what it actually costs to live here. The MIT Living Wage Calculator, maintained by researchers at the Massachusetts Institute of Technology, answers one foundational question: how much does a family in your county need to earn just to cover the essentials — food, housing, childcare, medical care, transportation — without relying on government assistance?[MIT Living Wage Calculator, Dallas Co., Feb 15, 2026]
This is not a comfortable wage. It is not a living standard that includes savings, vacations, or retirement. It is a survival floor. For Dallas County — as of the February 15, 2026 data release — the most common type of working family in HD109 (two adults, one working, two children) needs $80,866 per year just to cover the basics.[MIT Living Wage Calculator, Dallas Co., Feb 15, 2026]
Three of Five Income Quintiles Fall Below This Floor
The BLS Consumer Expenditure Survey shows that Q1 ($15,044 avg income), Q2 ($39,679), and Q3 ($68,731) all earn less than the canonical family floor of $80,866/yr. Most Texas households are below the survival threshold for a family with two children.[BLS CE TX 2022–23; MIT Living Wage Calculator, Dallas Co., Feb 15, 2026]
| Household Type | Annual MIT Floor | After-Tax Est. | Notes |
|---|---|---|---|
| 1 Adult, 0 Children | $48,489 | $41,399 | Single-adult survival floor; no dependents |
| 1 Adult, 1 Child | $78,832 | $70,117 | Single parent; one child |
| 1 Adult, 2 Children | $99,239 | $88,273 | Single parent; two children; childcare critical |
| 2 Adults, 1 Working, 0 Children | $64,034 | — | Couple; one earner; no dependents |
| 2 Adults, 1 Working, 2 Children ▶ CANONICAL | $80,866 | — | Canonical TPTRP family archetype |
| 2 Adults, Both Working, 2 Children | $107,251 | — | Dual-income; two children |
These numbers define the conversation. Every discussion of taxes must begin here, because the tax system doesn't operate in the abstract — it operates on top of real family budgets that are already stretched thin. When you understand what it costs just to survive in Dallas County, the tax burden that sits on top of that becomes impossible to ignore.[MIT Living Wage Calculator, Dallas Co., Feb 15, 2026]
What You Pay Today
The full property and sales tax burden by household type and by income quintile — in 2025 dollars.
Texas has no state income tax, but it compensates with two of the heaviest property and sales tax burdens in the country. For HD109 homeowners, the combined effective property tax rate is 2.0265% — meaning on the average HD109 home ($257,838 per ACS 2019–23), the property tax bill alone is $5,225/yr.[TX Comptroller PTAD TY2025] Renters aren't exempt: landlords pass an estimated 18.5% of their property tax costs through into rent, so renters effectively pay a property tax too — it's just hidden in their monthly payment.[TCPA Research Report 96-463, Jan 2025]
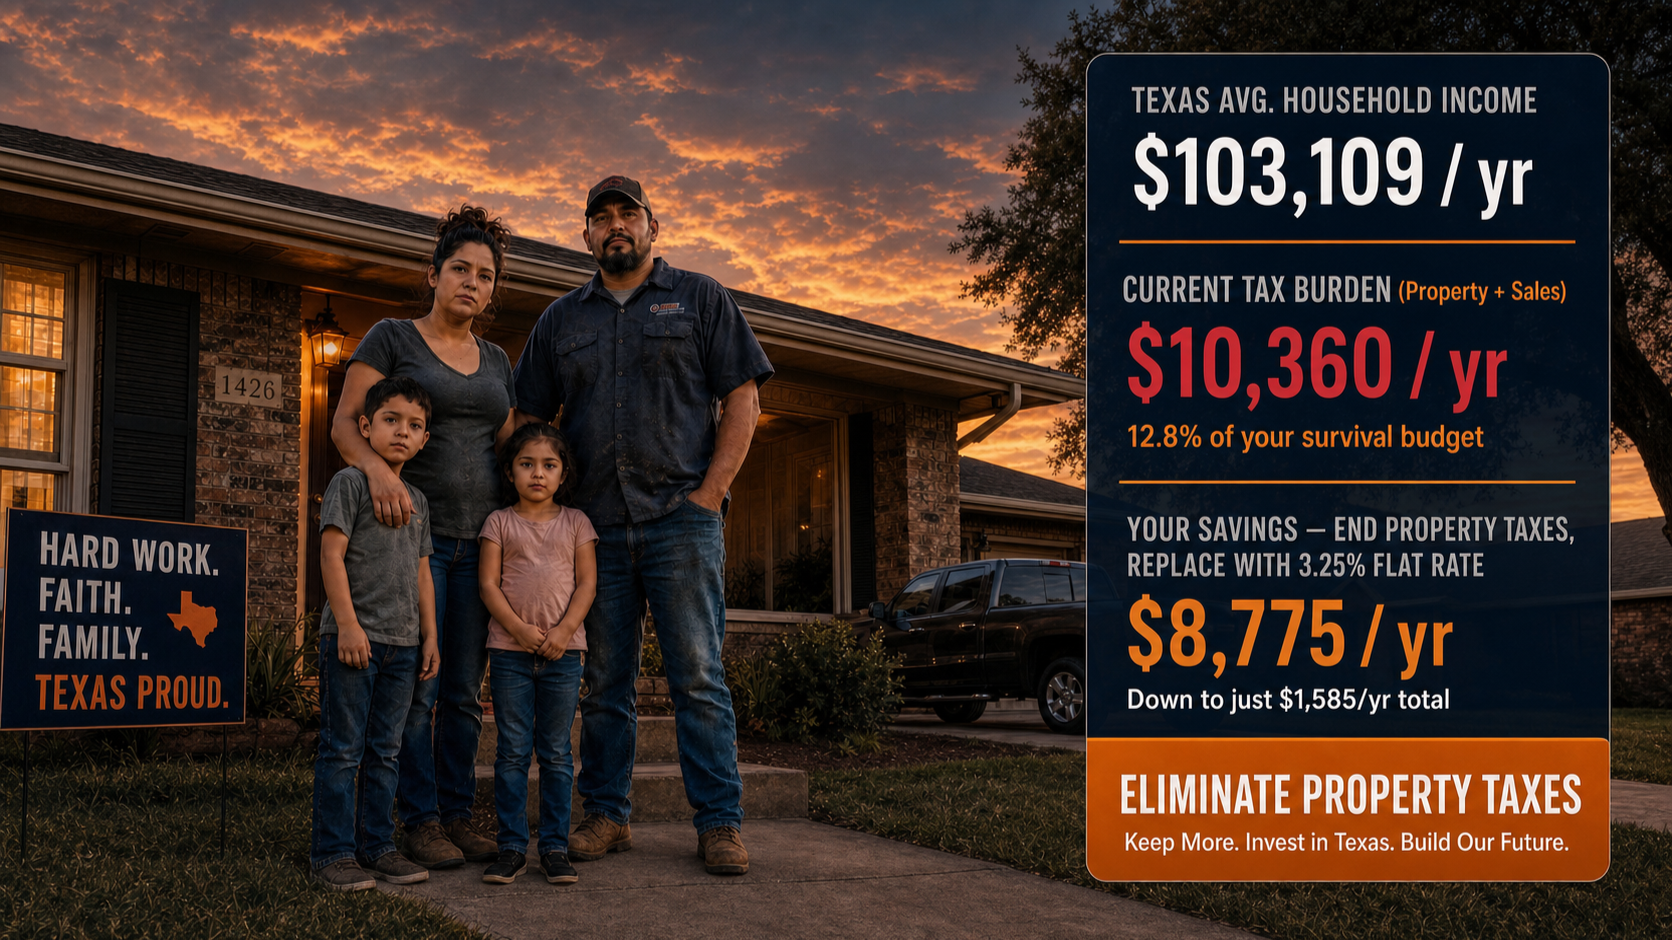
On top of that sits Texas's combined sales tax rate of up to 8.25% on all taxable purchases (state 6.25% + local up to 2.00%). Groceries, prescription drugs, and rent are currently exempt, but most other spending faces this rate. Together, the two-adult, one-working, two-child canonical family that needs $80,866 just to cover the basics pays a combined $10,360 per year in property taxes and sales taxes — 12.8% of their entire MIT survival budget — before a single dollar goes to food, rent, or childcare.[MIT Living Wage Calculator, Dallas Co.][TX Comptroller PTAD TY2025][BLS CE TX 2022–23]
| Household Type | MIT Floor | Property Tax | Sales Tax | Combined Burden | % of MIT Floor |
|---|---|---|---|---|---|
| 1 Adult, 0 Children | $48,489 | $5,225 | $2,807 | $8,032 | 16.6% |
| 1 Adult, 1 Child | $78,832 | $5,225 | $4,201 | $9,426 | 12.0% |
| 1 Adult, 2 Children | $99,239 | $5,225 | $5,135 | $10,360 | 10.4% |
| 2 Adults, 1 Working, 0 Children | $64,034 | $5,225 | $3,625 | $8,850 | 13.8% |
| 2 Adults, 1 Working, 2 Children ▶ | $80,866 | $5,225 | $5,135 | $10,360 | 12.8% |
| 2 Adults, Both Working, 2 Children | $107,251 | $5,225 | $6,819 | $12,044 | 11.2% |
| HD109 Median HH ($57,836) | $80,866* | $5,225 | $4,201 | $9,426 | 11.7%* |
What the Quintile Data Tells Us
Looking across the full Texas income distribution, the BLS Consumer Expenditure Survey covers 11,392,871 consumer units, divided into five income quintiles. All figures are escalated to 2025 dollars using the BEA SAGDP2 Texas nominal GDP escalator of ×1.13183.[BLS CE TX 2022–23][BEA SAGDP2 TX, 2025]
| Quintile | Avg Income (2025$) | Avg Total Exp (2025$) | % Homeowners | % Renters | Profile |
|---|---|---|---|---|---|
| Q1 (Bottom 20%) | $15,044 | $38,852 | 44.9% | 55.1% | Fixed-income, part-time, majority renters |
| Q2 (Second 20%) | $39,679 | $53,927 | 49.5% | 50.5% | Service workers; mixed rental/ownership |
| Q3 (Middle 20%) | $68,731 | $62,536 | 60.5% | 39.5% | Working families; median TX profile |
| Q4 (Fourth 20%) | $117,243 | $86,923 | 70.1% | 29.9% | Predominantly homeowners; higher discretionary |
| Q5 (Top 20%) | $230,158 | $147,199 | 86.0% | 14.0% | High homeownership; significant investment income |
| All TX Households | $103,108 | $79,004 | 62.7% | 37.3% | 11,392,871 consumer units statewide |
The 5.24× Regressivity Gap
Why property taxes hit working families hardest — and what the numbers actually look like across all five income quintiles.
"Regressive" means a tax takes a larger share of income from people who earn less. Texas property taxes are regressive in the most direct way possible: whether you earn $30,000 or $300,000, the tax is based on your home's value, not your income. For a lower-income family, that same dollar of property tax represents a far larger portion of what they bring home.[BLS CE TX 2022–23][TX Comptroller PTAD TY2025]
For renters, there is an additional layer of injustice. Landlords pass a portion of their property tax costs into rent. Research by the Texas Comptroller's own office documents this passthrough at 10%–30% of the landlord's property tax bill — with a midpoint estimate of 18.5%.[TCPA Research Report 96-463, Jan 2025] Using that midpoint, here is what property taxes actually cost each quintile in 2025 dollars:
| Quintile | Avg Income (2025$) | Direct PT (2025$) | Renter Passthrough | Total L1 Burden | % of Income |
|---|---|---|---|---|---|
| Q1 (Bottom 20%) | $15,044 | $1,017 | $1,165 | $2,182 | 14.5% |
| Q2 (Second 20%) | $39,679 | $1,726 | $1,290 | $3,016 | 7.6% |
| Q3 (Middle 20%) | $68,731 | $2,413 | $1,056 | $3,469 | 5.0% |
| Q4 (Fourth 20%) | $117,243 | $3,388 | $1,181 | $4,569 | 3.9% |
| Q5 (Top 20%) | $230,158 | $6,386 | $830 | $7,216 | 2.77% |
| All TX HH | $103,108 | $3,049 | $1,101 | $4,150 | 4.0% |
"A Q1 Texas household pays 14.5 cents of every dollar of income in property taxes — directly or through their rent. A Q5 household pays just 2.77 cents. That 5.24× gap is not a side effect of the system. It is the system."TPTRP Household Expenditure Analysis — BLS CE TX 2022–23 · TX Comptroller Pub. 96-463 · June 2026
To understand what "14.5% of income" means in human terms: a Q1 Texas household earning $15,044/yr — less than $1,300/month — pays $2,182 per year in property taxes before they buy groceries. That is nearly two months of one of their smallest paychecks, gone to a tax that bills the same effective rate whether you are making $15,000 or $230,000.[BLS CE TX 2022–23]
| Quintile | L1 Property Tax | Current Sales Tax | Combined Burden | % of Income | % of Spending |
|---|---|---|---|---|---|
| Q1 (Bottom 20%) | $2,182 | $2,021 | $4,203 | 27.9% | 10.8% |
| Q2 (Second 20%) | $3,016 | $3,084 | $6,100 | 15.4% | 11.3% |
| Q3 (Middle 20%) | $3,469 | $3,735 | $7,204 | 10.5% | 11.5% |
| Q4 (Fourth 20%) | $4,569 | $5,490 | $10,059 | 8.6% | 11.6% |
| Q5 (Top 20%) | $7,216 | $10,226 | $17,442 | 7.6% | 11.8% |
| All TX HH | $4,150 | $4,997 | $9,147 | 8.9% | 11.6% |
The Hidden Business Tax Passthrough
How Texas business property taxes, the BPP tax, and the franchise tax become household costs — invisibly embedded in every price Texans pay.
The tax burden on Texas families is larger than it appears in the direct property and sales tax figures. That's because Texas businesses — which pay 59.3% of all state and local taxes in Texas, compared to the national average of 43.6% — embed those costs in the prices of every product and service they sell.[EY/COST FY2024 Total State and Local Business Taxes] Texas ranks 14th highest nationally in effective business tax burden — not the low-tax haven its reputation suggests.
The Three Business Tax Mechanisms
Commercial Property Tax → Consumer Prices. The statewide TY2025 property tax levy is $89.45 billion.[TX Comptroller PTAD TY2025] Of that, approximately 47.6% — roughly $42.6 billion per year — is paid by Texas businesses on commercial real property, industrial property, and business personal property.[TX Comptroller Pub. 96-463, Jan 2025] Every warehouse, factory, storefront, and distribution center pays this tax annually — and every dollar of it is a fixed operating cost that flows through to the prices of goods and services.[Baker Institute, Rice University, Feb 2025] Texas's average effective commercial property tax rate of 1.91% is two to four times higher than comparable markets: Seattle/King County runs 1.0–1.2%; Denver runs 0.5–0.7%.[Innergy Integral, 2026]
Business Personal Property (BPP) Tax → Capital Investment Suppression → Higher Prices. Texas is one of only a handful of states that aggressively taxes business personal property — furniture, computers, machinery, vehicles, and fixtures — in addition to real property. The BPP tax generates an estimated $8.05 billion per year in tax obligations.[TX Comptroller PVS 2023] It creates a direct disincentive to capital investment: every piece of equipment a business acquires increases its annual tax bill in perpetuity. This suppresses productivity improvements that would otherwise reduce consumer prices — meaning BPP taxes don't just cost businesses money, they cost consumers money in the form of slower technology adoption and less efficient supply chains.
Franchise Tax → Operating Cost Passthrough. The franchise tax generates $7.08 billion per year in state revenue.[TX Comptroller FY2025 Annual Cash Report] It hits every Texas business with revenue over $2.47 million at rates of 0.375% to 0.75% on margin. This is a fixed annual cost — a business can owe franchise tax in a loss year — and it flows directly into pricing. Analysis from the Bush School of Government and Public Service at Texas A&M found that many firms spend more on franchise tax compliance than the tax itself, with the tax being "particularly hostile to the business services industry."[Bush School / Texas A&M, 2020]
The Invisible Tax on Every Purchase
When a Texas family buys groceries, hires a plumber, or fills a prescription, a portion of every price they pay includes the embedded cost of the seller's property taxes, BPP taxes, and franchise tax obligations. These taxes are real and significant — but they are invisible on the receipt. The current property and sales tax figures actually understate the total tax burden on Texas families.[TX Comptroller Pub. 96-463, Jan 2025; Baker Institute, Feb 2025]
| Tax / Mechanism | Annual Amount | Passthrough Mechanism | TPTRP Elimination Effect |
|---|---|---|---|
| Commercial Real Property Tax | ~$18.96B/yr | Embedded in lease rates, goods pricing, service pricing | Eliminated — $18.96B/yr cost removed from business operating costs |
| Business Personal Property (BPP) Tax | ~$8.05B/yr | Capital investment suppression; higher prices from lower productivity | Eliminated — capital investment incentive restored |
| Franchise Tax | $7.08B/yr | Fixed annual operating cost; embedded in pricing by all businesses ›$2.47M revenue | Abolished — constitutionally barred from return |
| Commercial Utility Sales Tax (8.25%) | Embedded in every product | Factory/warehouse operating costs passed to retail prices | Rate drops 8.25% → 3.25% — 5-point reduction on commercial utilities |
| Production Taxes (Oil + Gas) | ~$6.2B/yr | Fuel supply chain embedded costs → pump prices + downstream goods | Eliminated — entire wellhead-to-pump tax stack abolished |
| Residential PT → Rent Passthrough | ~$972/yr avg renter HH | 18.5% of gross rent = embedded PT recovery (TX Comptroller midpoint) | Eliminated — residential PT abolished; TLES-2 exempts rent from TPTRP |
Six Business Profiles: What the Current System Costs
The TPTRP Business Impact Analysis quantified the current tax burden for six representative Texas business profiles. Five of six show dramatic net reductions under TPTRP; one (Technology/SaaS) shows a modest increase due to its low current asset base.[TPTRP-7 Business Impact Article v7, June 2026]
| Industry Profile | Current System | Under TPTRP (SCR) | Net Change | % Change |
|---|---|---|---|---|
| Commercial Real Estate ($15M, DFW) | $317,850 | $5,850 | −$312,000 | −98% |
| Warehouse / 3PL ($30M rev, 500K sqft) | $1,153,500 | $91,000 | −$1,062,500 | −92% |
| Oil & Gas E&P ($150M rev, Permian) | $9,277,250 | $1,137,500 | −$8,139,750 | −88% |
| Restaurant Chain (5 locs, $10M rev) | $304,500 | $91,000 | −$213,500 | −70% |
| Manufacturing ($80M rev, $35M assets) | $1,026,000 | $845,000 | −$181,000 | −18% |
| Technology / SaaS ($20M B2B rev) | $85,000 | $100,750 | +$15,750 | +19% |
| Combined (all 6 profiles) | $12,164,100 | $2,266,100 | −$9,898,000 | −81% |
When businesses pay less in property taxes, BPP taxes, and franchise taxes, the directional impact on consumer prices is downward. For capital-intensive sectors like commercial real estate, manufacturing, warehousing, and oil and gas — the sectors that produce the physical goods and facilities that Texas families use every day — TPTRP removes the largest component of their embedded cost structure. The benefit flows to consumers in the form of lower price pressure across the supply chain.[Baker Institute, Feb 2025; TPTRP-7 Business Impact Article v7]
What the TLES Protects
The 12 Texas Living Essentials Standard categories that are completely exempt from the TPTRP sales tax — and why lower-income households benefit most.
The TPTRP replaces the entire current property and sales tax system with a single 3.25% rate — but only on spending that isn't essential. The 12 categories of the Texas Living Essentials Standard (TLES) are completely exempt. The reason this produces a progressive outcome from a flat rate is structural: lower-income households spend a much larger share of their budgets on these necessities than higher-income households do.[BLS CE TX 2022–23; TPTRP TLES Workbook v8, June 16, 2026]
The total statewide value of TLES-exempt spending is $867.01 billion per year — representing an enormous portion of the state's economic activity that is entirely off the TPTRP tax base.[TPTRP TLES Workbook v8, June 16, 2026]
| # | TLES Category | Annual Value (FY2025) | Legally Required? | Primary Source |
|---|---|---|---|---|
| TLES-1 | Groceries (Food at Home) | $97.19B | No (currently exempt) | USDA ERS Food Expenditure Series 2024 |
| TLES-2 | Residential Rent | $71.02B | No | Census ACS 2024 |
| TLES-3 | Home Utilities (Electric, Gas, Water) | $40.60B | No (partially exempt currently) | EIA-861 + EIA SEDS + TCEQ |
| TLES-4 | Prescription Drugs | $41.56B | No (currently exempt) | CMS NHEA 2024 |
| TLES-5 | Medical Care & Health/Dental Insurance | $340.0B | No (currently exempt) | CMS NHEA 2024 |
| TLES-6 | Education Services | $32.98B | No | SHEEO SHEF FY2024 + NCES |
| TLES-7 | Gasoline at the Pump (Consumer) | $63.50B | No | EIA TX Energy Profile 2025 |
| TLES-8 | Childcare and Early Childhood Education | $19.15B | No | Child Care Aware of America 2024 |
| TLES-9 | Primary-Residence Home Purchase | $93.26B | No | TX REALTORS 2024 + NAR 2024 |
| TLES-10 | Residential Property Insurance | $20.19B | Effectively (lender req.) | NAIC 2024 TX P&C Market Scorecard |
| TLES-11 | Personal Auto Insurance | $32.12B | Yes — TX Transp. Code §601.072 | NAIC 2024 TX Market Scorecard |
| TLES-12 | Individual Life Insurance Premiums | $15.45B | No | ACLI 2024 Fact Book (TX 8.09% share) |
| Total — All 12 TLES Categories | $867.01B | $867.01B removed from TPTRP tax base | ||
Why TLES Makes TPTRP Progressive
The TLES exemption produces a naturally progressive outcome from a flat rate because Q1 households have 50.2% of their spending fully protected, while Q5 households have only 25.4% protected. Lower-income households spend proportionally more on groceries, rent, gas, utilities, and medical care — the exact categories the TLES exempts.[BLS CE TX 2022–23]
| Quintile | Total Exp (2025$) | TLES Exempt | TLES as % of Spending | Q_TAXABLE | TPTRP @ 3.25% |
|---|---|---|---|---|---|
| Q1 (Bottom 20%) | $38,852 | $19,340 | 50.2%* | $19,512 | $634 |
| Q2 (Second 20%) | $53,927 | $22,992 | 42.6% | $30,935 | $1,005 |
| Q3 (Middle 20%) | $62,536 | $26,272 | 42.0% | $36,264 | $1,179 |
| Q4 (Fourth 20%) | $86,923 | $31,071 | 35.7% | $55,852 | $1,815 |
| Q5 (Top 20%) | $147,199 | $37,457 | 25.4% | $109,742 | $3,567 |
| All TX HH | $79,004 | $27,612 | 35.0% | $51,392 | $1,670 |
What TPTRP Changes
Side-by-side: what every quintile and every household archetype pays, saves, and experiences under the Texas Property Tax Replacement Plan at the 3.25% Starting Cap Rate.
The Texas Property Tax Replacement Plan (TPTRP) makes a complete structural swap: out with all property taxes and the current 8.25% sales tax; in with a single flat 3.25% Starting Cap Rate (SCR) applied only to non-TLES spending. The Final Tax Base (FTB) is $7.127 trillion — a broad enough base that 3.25% fully replaces all current tax revenue.[TPTRP-1 Tax Base Article v9; TPTRP-5 Waterfall Article v4]
SCR 3.25% = T1 State (1.00%) + T2 County (0.40%) + T3 City (0.60%) + T4 ISD (1.20%) + T5 Special Districts (0.05%). AFR (Aggregate Floor Rate) = 2.8559% — the minimum combined rate needed to fund all TROs. CCR (Constitutional Cap) = 6.00% — the hard constitutional ceiling that no combination of tiers may ever exceed.
| Quintile | Avg Income | Current Burden | Current % of Inc. | TPTRP @ SCR | TPTRP % of Inc. | Net Savings | MIT Floor Context |
|---|---|---|---|---|---|---|---|
| Q1 (Bottom 20%) | $15,044 | $4,203 | 27.9% | $634 | 4.2% | $3,569 | BELOW single-adult floor ($48,489) |
| Q2 (Second 20%) | $39,679 | $6,100 | 15.4% | $1,005 | 2.5% | $5,095 | BELOW 1A+1Ch floor ($78,832) |
| Q3 (Middle 20%) | $68,731 | $7,204 | 10.5% | $1,179 | 1.7% | $6,025 | BELOW canonical family floor ($80,866) |
| Q4 (Fourth 20%) | $117,243 | $10,059 | 8.6% | $1,815 | 1.5% | $8,244 | Above all MIT floors |
| Q5 (Top 20%) | $230,158 | $17,442 | 7.6% | $3,567 | 1.5% | $13,875 | Well above all MIT floors |
| All TX HH Avg | $103,108 | $9,147 | 8.9% | $1,670 | 1.6% | $7,477 | — |
What the Savings Mean in Real Life
- Q1 saves $3,569/yr. For a household earning $15,044/yr, that is 23.7% of their annual income returned — nearly three months of their entire budget. If a Q1 household spends roughly $297/month on food, $3,569 in savings covers 12 months of groceries.[BLS CE TX 2022–23]
- Q3 saves $6,025/yr. The middle quintile saves more than the average monthly mortgage payment in Dallas County — money that currently goes to state and local governments, redirected back to the household's own priorities.[BLS CE TX 2022–23]
- The average Texas household saves $7,477/yr. That is more than one additional month of after-tax income, returned every single year.
- The canonical working family saves $8,775/yr. That is 10.85% of the MIT Living Wage survival floor for a two-adult, two-child family in Dallas County ($80,866) — reclaimed on Day One.[MIT Living Wage Calculator, Dallas Co., Feb 15, 2026]
| Household Archetype | MIT Floor | Today's Burden | TPTRP @ SCR | Annual Savings | Savings as % of MIT |
|---|---|---|---|---|---|
| 1 Adult, 0 Children | $48,489 | $8,032 | $875 | $7,157 | 14.8% |
| 1 Adult, 1 Child | $78,832 | $9,426 | $1,481 | $7,945 | 10.1% |
| 1 Adult, 2 Children | $99,239 | $10,360 | $1,865 | $8,495 | 8.6% |
| 2 Adults, 1 Working, 0 Children | $64,034 | $8,850 | $1,197 | $7,653 | 12.0% |
| 2 Adults, 1 Working, 2 Children ▶ CANONICAL | $80,866 | $10,360 | $1,585 | $8,775 | 10.85% |
| 2 Adults, Both Working, 2 Children | $107,251 | $12,044 | $2,033 | $10,011 | 9.3% |
| HD109 Median HH ($57,836) | $80,866* | $9,426 | $1,056 | $8,370 | 10.4%* |
"The canonical Texas working family — two adults, one working, two children — saves $8,775 per year under TPTRP. That is 10.85% of the minimum annual income they need to survive in Dallas County, returned to them by eliminating a tax they should never have been paying."TPTRP Impact Analysis — Dallas County Working Families · June 2026
What It Means for HD109
Cedar Hill, DeSoto, Lancaster, Glenn Heights, and the working families of House District 109 — specific numbers, specific impact.
HD109 covers Cedar Hill, DeSoto, Lancaster, Glenn Heights, and surrounding communities in southern Dallas County. The median household income here is $57,836/yr (ACS 2019–23) — well below the MIT survival floor of $80,866 for a family with two kids. At the same time, HD109's combined effective property tax rate of 2.0265% is higher than the statewide average, meaning the same structural injustice bites harder here than in most of Texas.[TX Legislative Council ACS 405 PLANH2316; TX Comptroller PTAD TY2025]
HD109 also has a 28.5% renter rate. That matters because under the current system, renters pay a hidden property tax embedded in their monthly rent — approximately 18.5% of the landlord's property tax bill passed through to tenants. Under TPTRP, two things happen simultaneously: (1) the landlord's property tax disappears entirely, removing the pressure to embed that cost in rent; and (2) residential rent is TLES-2 exempt — meaning renters pay zero TPTRP on their rent payment.[TCPA Research Report 96-463, Jan 2025]
HD109 Workforce Reality
BLS OEWS May 2024 data shows that 13 of 22 occupational groups in Texas fall below the MIT single-adult survival floor ($48,489/yr), and 18 of 22 fall below the canonical family floor ($80,866/yr). HD109's workforce is concentrated in the sectors that fall hardest below these floors — healthcare support, food service, building maintenance, sales, and administrative support.[BLS OEWS May 2024 TX; MIT Living Wage Calculator, Dallas Co., Feb 15, 2026]
HD109 Was Built by Working Families
Cedar Hill ISD teachers, DeSoto police officers, Lancaster healthcare workers, and service sector employees throughout the district all face the same structural injustice: a tax system that takes the most from the people who can afford it least. HD109's below-median income, above-average property tax rate, and significant renter population make it a genuine stress test for TPTRP — and the data shows the plan delivers meaningful relief.[ACS 2019–23; TX Comptroller PTAD TY2025; BLS CE TX 2022–23]
| HD109 Household Type | Median Income | Current Tax Burden | TPTRP @ SCR | Annual Savings | Monthly Relief |
|---|---|---|---|---|---|
| Median HH — Owner-Occupied | $57,836 | $9,426 | $1,056 | $8,370 | $697/mo |
| Median HH — Renter | $57,836 | $7,948 | $1,056 | $6,892 | $574/mo |
| Single Adult (1A 0Ch — MIT $48,489) | ~$48,489 | $8,032 | $875 | $7,157 | $596/mo |
| Single Parent, 2 Children (MIT $99,239) | ~$57,836 | $10,360 | $1,865 | $8,495 | $708/mo |
| Canonical Family (2A/1Wkg/2Ch — MIT $80,866) | $80,866 | $10,360 | $1,585 | $8,775 | $731/mo |
The math is straightforward and it comes from primary government sources: the Bureau of Labor Statistics, the Bureau of Economic Analysis, the Texas Comptroller's own property tax data, and the MIT Living Wage Calculator. The question is not whether the savings are real. They are. The question is whether Texans will demand the change that makes them happen.[BLS CE TX 2022–23; BEA SAGDP2 TX; TX Comptroller PTAD TY2025; MIT Living Wage Calculator, Feb 15, 2026]
Supporting Data
Complete data tables, methodology notes, and expanded analysis for each section of this article. All figures sourced from primary government data.
| Household Type | Annual Floor | Food | Childcare | Medical | Housing | Transport | Other |
|---|---|---|---|---|---|---|---|
| 1 Adult, 0 Children | $48,489 | $4,019 | $0 | $3,032 | $17,805 | $8,440 | $8,104 |
| 1 Adult, 1 Child | $78,832 | $5,896 | $10,755 | $8,759 | $21,732 | $9,767 | $13,209 |
| 1 Adult, 2 Children | $99,239 | $8,834 | $21,211 | $8,906 | $21,732 | $12,303 | $15,286 |
| 2 Adults (1 Working), 0 Children | $64,034 | $7,369 | $0 | $7,214 | $18,547 | $9,767 | $13,782 |
| 2 Adults (1 Working), 2 Children ▶ | $80,866 | $11,763 | $0 | $9,986 | $21,732 | $14,156 | $17,375 |
| 2 Adults (Both Working), 2 Children | $107,251 | $11,763 | $21,211 | $9,986 | $21,732 | $14,156 | $17,682 |
| Category | All HH | Q1 | Q2 | Q3 | Q4 | Q5 |
|---|---|---|---|---|---|---|
| Avg Income (2025$) | $103,108 | $15,044 | $39,679 | $68,731 | $117,243 | $230,158 |
| Total Expenditures | $79,004 | $38,852 | $53,927 | $62,536 | $86,923 | $147,199 |
| Housing — Total | $25,354 | $16,465 | $19,045 | $21,196 | $27,413 | $47,553 |
| Owned dwellings | $10,271 | $1,317 | $3,052 | $7,099 | $13,778 | $28,170 |
| Rented dwellings | $5,947 | $6,298 | $6,973 | $5,710 | $6,382 | $4,481 |
| Utilities, fuels, public svcs | $5,319 | $4,831 | $5,129 | $5,016 | $5,470 | $6,384 |
| Transportation — Total | $14,394 | $7,237 | $10,485 | $12,841 | $16,410 | $26,020 |
| Gasoline & motor fuels | $3,468 | $1,998 | $2,874 | $3,165 | $3,868 | $5,512 |
| Food — Total | $11,632 | $7,294 | $9,038 | $10,290 | $12,648 | $19,547 |
| Food at home (groceries) | $6,990 | $4,759 | $5,738 | $6,215 | $7,577 | $10,977 |
| Food away from home | $4,643 | $2,535 | $3,301 | $4,075 | $5,071 | $8,570 |
| Healthcare — Total | $6,547 | $4,271 | $5,374 | $5,995 | $7,086 | $10,410 |
| Entertainment | $3,618 | $1,306 | $2,087 | $2,972 | $3,885 | $7,714 |
| Apparel & Services | $2,410 | $962 | $1,549 | $1,995 | $2,619 | $5,114 |
| Education | $1,557 | $474 | $715 | $1,051 | $1,514 | $4,039 |
| Personal Insurance & Pensions | $9,027 | $695 | $3,343 | $6,755 | $13,542 | $24,757 |
TLES-10 (Residential Property Insurance) revised to $20.19B using NAIC CY2024 TX P&C Market Scorecard. TLES-12 (Individual Life Insurance) confirmed at $15.45B using ACLI 2024 Fact Book × TX 8.09% share. Q_TAXABLE ratio corrected to 0.65 (was 0.69 before the 3 insurance categories were added to TLES). All savings figures in this article reflect the updated 12-category set.
| Occupational Group | Median Annual ($) | vs. MIT 1A Floor ($48,489) | vs. Family Floor ($80,866) | Net TPTRP Savings |
|---|---|---|---|---|
| Management | $136,370 | ABOVE | ABOVE | $8,549 |
| Business & Financial Operations | $79,690 | ABOVE | BELOW ↓$1,176 | $7,167 |
| Computer & Mathematical | $113,850 | ABOVE | ABOVE | $8,000 |
| Healthcare Practitioners | $84,600 | ABOVE | ABOVE | $7,288 |
| Community & Social Service | $54,820 | ABOVE | BELOW ↓$26,046 | $6,561 |
| Educational Instruction | $61,560 | ABOVE | BELOW ↓$19,306 | $6,726 |
| Construction & Extraction | $57,720 | ABOVE | BELOW ↓$23,146 | $6,631 |
| Sales & Related | $42,510 | BELOW ↓$5,979 | BELOW | $6,261 |
| Office & Administrative Support | $46,470 | BELOW ↓$2,019 | BELOW | $6,358 |
| Healthcare Support | $34,070 | BELOW ↓$14,419 | BELOW | $6,055 |
| Food Preparation & Serving | $31,090 | BELOW ↓$17,399 | BELOW | $5,982 |
| Building & Grounds Maintenance | $35,660 | BELOW ↓$12,829 | BELOW | $6,094 |
| Personal Care & Service | $34,750 | BELOW ↓$13,739 | BELOW | $6,072 |
| Transportation & Material Moving | $47,260 | BELOW ↓$1,229 | BELOW | $6,377 |
| Production | $43,990 | BELOW ↓$4,499 | BELOW | $6,297 |
References
Sources organized by article section. APA 7th Edition. All sources are primary-source government data, peer-reviewed research, or nationally recognized industry publications. No internal workbooks cited.
Survival Floor & Living Wage Benchmark — Section 1
Glasmeier, A. K., & Massachusetts Institute of Technology. (2026, February 15). Living Wage Calculator — Dallas County, Texas. MIT. https://livingwage.mit.edu/counties/48113
Primary source for all MIT living wage budget figures. Dallas County TX data retrieved February 15, 2026. Household archetypes: 1A 0Ch ($48,489), 1A 1Ch ($78,832), 1A 2Ch ($99,239), 2A 1Wkg 0Ch ($64,034), 2A 1Wkg 2Ch ($80,866 — canonical TPTRP family), 2A BothWkg 2Ch ($107,251). Used throughout Sections 1, 2, 6, and 7 for survival floor benchmarks and savings-as-percentage calculations.
Consumer Expenditure Data & Economic Escalation — Sections 2, 3, 5, 6
U.S. Bureau of Labor Statistics. (2024). Consumer Expenditure Survey — Texas, Income Quintiles Before Taxes, 2-Year Average 2022–2023. U.S. Department of Labor. https://www.bls.gov/cex/
Primary source for all Texas income quintile and expenditure data. TX CU weight: 11,392,871. Raw figures escalated to 2025 dollars using BEA SAGDP2 TX escalator ×1.13183. Income quintiles (2025$): Q1=$15,044, Q2=$39,679, Q3=$68,731, Q4=$117,243, Q5=$230,158. Total expenditures (2025$): Q1=$38,852 through Q5=$147,199. Foundation for all quintile burden, TLES, savings, and regressivity calculations.
U.S. Bureau of Economic Analysis. (2025). GDP by State — SAGDP2: GDP by Industry (All Industries) — Texas, 2022–2025. BEA Regional Data. https://apps.bea.gov/regional/
Source for BEA SAGDP2 TX private-industries nominal GDP escalator = 1.13183, computed as FY2025 TX private-industries GDP ÷ average(FY2022, FY2023) TX private-industries GDP. Applied to all BLS CE TX 2022–23 raw figures to produce 2025-dollar baseline throughout this article.
Property Tax Data — Sections 2, 3, 7
Texas Comptroller of Public Accounts, Property Tax Assistance Division (PTAD). (2026, January 28). 2025 Property Tax Rates and Levies — All Texas Taxing Units. Austin, TX: PTAD. https://comptroller.texas.gov/taxes/property-tax/rates/
Official state data for TY2025 statewide property tax levy ($89.45B), HD109 combined effective rate (2.0265%), and HD109 average annual owner property tax ($5,225 on avg home $257,838). Used in every section involving property tax burden calculations.
Texas Comptroller of Public Accounts. (2025, January). Property Tax and Rent: The Renter's Share — Research Report 96-463. Austin, TX: TCPA. https://comptroller.texas.gov/taxes/publications/96-463.pdf
Source for the 10%–30% renter property tax passthrough range. TPTRP uses the 18.5% midpoint as the canonical renter passthrough rate for all Level 1 burden calculations. Also documents commercial property tax passthrough mechanism to tenant lease rates and consumer prices — foundation for Section 4 business passthrough analysis.
Business Tax Data & Passthrough — Section 4
Ernst & Young / Council on State Taxation (COST). (2025, August). Total State and Local Business Taxes FY2024. https://www.ey.com/en_us
Annual national study of state and local business tax burdens. Source for Texas's 59.3% business share of all state and local taxes (national avg: 43.6%) and Texas's 14th-highest national ranking in effective business tax burden. Primary citation for the "Texas is not a low-tax state for businesses" framing in Section 4 Overview.
Texas Comptroller of Public Accounts. (2025, September). State of Texas Annual Cash Report FY2025. https://comptroller.texas.gov/transparency/
Official state fiscal document. Source for FY2025 franchise tax revenue ($7.08B) cited in Section 4. Also source for oil production tax, natural gas production tax, and all other state tax revenue figures in the business profile analysis.
Texas Comptroller of Public Accounts. (2025, January). Tax Exemptions and Tax Incidence Report (Publication 96-463). https://comptroller.texas.gov/taxes/publications/96-463.pdf
Authoritative Comptroller analysis of who bears the Texas tax burden. Used in Section 4 for the non-residential share (~47.6%) of the statewide property tax levy and for documentation of the commercial property tax passthrough mechanism to tenant lease rates and retail prices.
Baker Institute for Public Policy, Rice University. (2025, February). Texas Property Tax and Grocery Supply Chain Cost Study. Rice University. https://www.bakerinstitute.org/
Independent academic study documenting how property taxes in the Texas grocery supply chain are embedded in retail food prices. Provides academic support for the commercial property tax passthrough mechanism described in Section 4. Particularly relevant to TLES-1 (groceries) and consumer food cost analysis.
Bush School of Government and Public Service, Texas A&M University. (2020). Giving an "F" to the Franchise Tax. https://bush.tamu.edu/
Peer-reviewed academic analysis of franchise tax compliance costs and structural hostility to service-sector businesses. Source for compliance-cost-exceeds-tax finding and "particularly hostile to business services" characterization. Used in Section 4 franchise tax passthrough discussion.
Innergy Integral. (2026, March). Texas Property Taxes and Real Estate Development. https://innergyintegral.com/
Cross-market analysis source for Texas commercial property tax rate comparison to Seattle/King County (1.0–1.2%) and Denver (0.5–0.7%). Source for "two to four times higher" characterization and 1.91% Texas average effective commercial rate. Used in Section 4.
Texas Comptroller of Public Accounts. (2023). Property Value Study — Category Statewide Totals, 2023. Property Tax Division. https://comptroller.texas.gov/taxes/property-tax/pvs/
Source for BPP levy estimate (~$8.05B/yr) and commercial real property levy estimate (~$18.96B/yr) derived by applying PVS 2023 category shares (Cat L1+L2+S for BPP; Cat F1+F2 for commercial real property) to TY2025 $89.45B total levy.
TLES Data — Section 5
National Association of Insurance Commissioners. (2025). 2024 Texas Property and Casualty Market Scorecard. NAIC Market Analysis. https://content.naic.org/research-statistics
Source for Texas homeowners insurance premium total ($20.19B, TLES-10, CY2024) and Texas personal auto insurance premium total (~$32.12B, TLES-11, CY2024). The TLES-10 figure was revised on June 1, 2026 from $19.2B to $20.19B using CY2024 NAIC data. Basis for TLES-10 and TLES-11 exemption rationale and statewide value.
American Council of Life Insurers. (2025). ACLI Life Insurers Fact Book 2024 (Tables on premium and state distribution). ACLI. https://www.acli.com/tools-and-resources/fact-book
Source for Texas individual life insurance premium total ($15.45B, TLES-12, CY2024), derived from national total × Texas 8.09% share per ACLI state distribution tables. Basis for TLES-12 exemption rationale. TLES-12 covers personal life insurance only; commercial life insurance (COLI/key-man) remains taxable under TPTRP.
Child Care Aware of America. (2024). 2024 Price of Care: State and County Data on Childcare in America. CCAoA. https://www.childcareaware.org/
Source for TLES-8 (childcare) statewide annual value ($19.15B, FY2025). Used to establish the statewide childcare expenditure base exempt from TPTRP, protecting working parents from being taxed on the cost of going to work.
Demographic Data — Section 7
U.S. Census Bureau. (2024). American Community Survey 5-Year Estimates 2019–2023 — TX HD109 Legislative District (PLANH2316). TX Legislative Council ACS Data Release 405. https://data.census.gov/
Source for HD109 median household income ($57,836), average home value ($257,838), and renter rate (28.5%). Used in Section 7 and in all HD109-specific household burden calculations throughout the article.
U.S. Bureau of Labor Statistics. (2025, May). Occupational Employment and Wage Statistics, May 2024 — Texas, All Industries. U.S. Department of Labor. https://www.bls.gov/oes/current/oes_tx.htm
Source for Texas occupational median wages by group (May 2024 OEWS). Used in Section 7 workforce analysis to establish that 13 of 22 occupational groups fall below the MIT single-adult survival floor ($48,489/yr) and 18 of 22 fall below the canonical family floor ($80,866/yr).