
What Ending Property Taxes Means for TX House District 109
By Rep. Will Campbell · June 2026 · Texas Property Tax Replacement Plan
What Ending Property Taxes Means for House District 109
Every city, every school district. Real numbers from official records showing exactly how the Texas Property Tax Replacement Plan replaces property taxes in your community — without cutting a single service.
How the Texas Property Tax Replacement Plan Works
A tiered sales and use tax replaces every property tax bill — permanently.
The Texas Property Tax Replacement Plan (TPTRP) makes property taxes unconstitutional and replaces the revenue lost to every taxing entity in Texas — cities, counties, school districts, and special districts — through a structured, tiered sales and use tax applied to all economic transactions in the state.
The plan is built on a verified $7.13 trillion Final Taxable Base (FTB) — the total value of all taxable economic activity in Texas after standard exclusions. [A-1] Because this base is vastly larger than the current property-tax base, the rates needed to fully replace property taxes are remarkably low.
Instead of taxing what you own, the plan taxes what you spend — spreading the revenue obligation across every transaction in the economy rather than concentrating it on homeowners and businesses that hold real property.
Five Revenue Tiers
The plan organizes every taxing entity in Texas into five tiers, each with its own sales tax rate. Each tier's rate is set to generate enough revenue to replace 100% of current property taxes plus a 10% structural safety buffer — the Total Replacement Obligation (TRO).
- Tier 1 — State of Texas: 1.00% starting cap rate (SCR), 2.00% constitutional cap (CCR)
- Tier 2 — Counties: 0.40% SCR, 1.00% CCR
- Tier 3 — Cities: 0.60% SCR, 1.00% CCR
- Tier 4 — School Districts (ISDs): 1.20% SCR, 1.50% CCR
- Tier 5 — Special Districts: 0.05% SCR, 0.50% CCR
The combined system SCR is 3.25% — meaning a transaction taxed at every tier simultaneously faces a 3.25% total TPTRP replacement rate. [A-1]
All city and ISD figures use ZFAM (ZIP-based Final Taxable Base Allocation Method) — the controlling methodology for HD109 entities. ZFAM derives each entity's share of the Texas FTB from actual economic activity in their ZIP codes, producing a larger and more accurate taxable base than simple home-value estimates. All levy figures are from PTAD TY2025 certified data. ISD funding figures are from the TEA Foundation School Program (FSP) state aid model. [A-2][A-3][E-1]
Your City: Nine Communities, Zero Property Tax Bills
How each city in HD109 is funded today — and what replaces it under the plan.
House District 109 spans nine incorporated cities across southern Dallas County. Each city currently levies a property tax on homeowners, businesses, and landowners to fund municipal services. Under the TPTRP, those levies go to zero and are replaced by the city tier’s share of the plan’s broad-based transaction tax system. [A-2]
To make these tables readable, here is the methodology in plain English. FTB means Final Taxable Base — the total amount of taxable economic activity assigned to the city under the model. ZFAM means ZIP-based Final Taxable Base Allocation Method, which is the controlling method used here to assign each HD109 city its share of the statewide FTB from ZIP-code-level economic activity. PTAD is the Texas Property Tax Assistance Division, which provides the TY2025 levy and rate figures used as the current-law benchmark. [A-1][A-2][A-3]
TRO means Total Replacement Obligation. In the first tab, the comparison starts with simple 2025 property-tax plus 2025 sales-tax replacement, so readers can see whether the city tier’s SCR revenue covers the city’s combined current tax revenues before any extra buffer is added. In the second tab, TRO is shown in the stricter TPTRP form as the city’s 2025 property-tax revenue multiplied by 1.10, which is the plan’s standard levy-replacement benchmark with a 10 percent structural buffer. SCR means Starting Cap Rate, the opening tier rate in the plan, and CCR means Constitutional Cap Rate, the maximum rate allowed for that tier under the constitutional structure. [A-1][A-2][A-3]
In practical terms, the tables below ask a simple question: if we apply the city tier’s SCR to that city’s assigned FTB, how much revenue does it produce, and how does that compare with the city’s TRO? The coverage ratio is just projected TPTRP revenue divided by TRO. A ratio above 1.0 means the city is fully funded at that rate; a ratio below 1.0 means it would need either a higher authorized rate or another adjustment inside the plan’s structure.
| City | PT Levy 2025 | ST Revenue 2025 | Total Tax Rev | ZIP-Spine FTB | STHM FTB | SCR Rev (ZIP) | SCR Rev (STHM) | Coverage (STHM) | Coverage (ZIP) |
|---|---|---|---|---|---|---|---|---|---|
| Cedar Hill | $46.4M | $21.6M | $68.0M | $58.98B | $11.29B | $353.9M | $67.7M | 0.996× | 5.205× |
| DeSoto | $58.3M | $16.5M | $74.8M | $17.04B | $8.12B | $102.3M | $48.7M | 0.651× | 1.367× |
| Lancaster | $46.5M | $22.9M | $69.4M | $28.60B | $11.24B | $171.6M | $67.4M | 0.971× | 2.472× |
| Glenn Heights | $10.8M | $1.3M | $12.1M | $6.83B | $1.28B | $41.0M | $7.7M | 0.633× | 3.390× |
| Hutchins | $11.1M | $6.2M | $17.4M | $29.25B | $3.05B | $175.5M | $18.3M | 1.054× | 10.112× |
| Seagoville | $12.6M | $6.5M | $19.1M | $10.97B | $3.20B | $65.8M | $19.2M | 1.005× | 3.445× |
| Wilmer | $15.5M | $13.0M | $28.5M | $24.52B | $6.36B | $147.1M | $38.2M | 1.340× | 5.163× |
| Combine | $0.9M | $0.2M | $1.1M | $2.57B | $0.15B | $15.4M | $0.9M | 0.775× | 13.538× |
| Ferris | $2.9M | $1.7M | $4.6M | $9.89B | $0.82B | $59.3M | $4.9M | 1.064× | 12.882× |
SCR / CCR Revenue Range & Minimum Required Rate vs. Total Tax Revenue
| City | CCR Rev (STHM) | CCR Rev (ZIP) | CCR Cov (STHM) | CCR Cov (ZIP) | Min Rate (STHM) | Min Rate (ZIP) | CCR Covers STHM? |
|---|---|---|---|---|---|---|---|
| Cedar Hill | $112.9M | $589.8M | 1.661× | 8.676× | 0.602% | 0.115% | Yes — 0.602% |
| DeSoto | $81.2M | $170.4M | 1.086× | 2.278× | 0.921% | 0.439% | Yes — 0.921% |
| Lancaster | $112.4M | $286.0M | 1.619× | 4.120× | 0.618% | 0.243% | Yes — 0.618% |
| Glenn Heights | $12.8M | $68.3M | 1.058× | 5.646× | 0.945% | 0.177% | Yes — 0.945% |
| Hutchins | $30.5M | $292.5M | 1.757× | 16.854× | 0.569% | 0.059% | Yes — at SCR |
| Seagoville | $32.0M | $109.7M | 1.674× | 5.740× | 0.597% | 0.174% | Yes — at SCR |
| Wilmer | $63.6M | $245.2M | 2.232× | 8.605× | 0.448% | 0.116% | Yes — at SCR |
| Combine | $1.5M | $25.7M | 1.289× | 22.529× | 0.776% | 0.044% | Yes — 0.776% |
| Ferris | $8.2M | $98.9M | 1.781× | 21.478× | 0.562% | 0.047% | Yes — at SCR |
| City | PT Levy 2025 | ST Revenue 2025 | Total Tax Rev | TRO (PT × 1.10) | ZIP-Spine FTB | STHM FTB | SCR Rev (ZIP) | SCR Rev (STHM) | Coverage (STHM) | Coverage (ZIP) |
|---|---|---|---|---|---|---|---|---|---|---|
| Cedar Hill | $46.4M | $21.6M | $68.0M | $74.8M | $58.98B | $11.29B | $353.9M | $67.7M | 0.906× | 4.732× |
| DeSoto | $58.3M | $16.5M | $74.8M | $82.3M | $17.04B | $8.12B | $102.3M | $48.7M | 0.592× | 1.243× |
| Lancaster | $46.5M | $22.9M | $69.4M | $76.4M | $28.60B | $11.24B | $171.6M | $67.4M | 0.883× | 2.247× |
| Glenn Heights | $10.8M | $1.3M | $12.1M | $13.3M | $6.83B | $1.28B | $41.0M | $7.7M | 0.575× | 3.082× |
| Hutchins | $11.1M | $6.2M | $17.4M | $19.1M | $29.25B | $3.05B | $175.5M | $18.3M | 0.958× | 9.192× |
| Seagoville | $12.6M | $6.5M | $19.1M | $21.0M | $10.97B | $3.20B | $65.8M | $19.2M | 0.914× | 3.132× |
| Wilmer | $15.5M | $13.0M | $28.5M | $31.3M | $24.52B | $6.36B | $147.1M | $38.2M | 1.218× | 4.693× |
| Combine | $0.9M | $0.2M | $1.1M | $1.3M | $2.57B | $0.15B | $15.4M | $0.9M | 0.704× | 12.307× |
| Ferris | $2.9M | $1.7M | $4.6M | $5.1M | $9.89B | $0.82B | $59.3M | $4.9M | 0.967× | 11.711× |
SCR / CCR Revenue Range & Minimum Required Rate vs. TRO = (PT + ST) × 1.10
| City | CCR Rev (STHM) | CCR Rev (ZIP) | CCR Cov (STHM) | CCR Cov (ZIP) | Min Rate (STHM) | Min Rate (ZIP) | CCR Covers STHM? |
|---|---|---|---|---|---|---|---|
| Cedar Hill | $112.9M | $589.8M | 1.510× | 7.887× | 0.662% | 0.127% | Yes — 0.662% |
| DeSoto | $81.2M | $170.4M | 0.987× | 2.071× | 1.013% | 0.483% | No — 1.013% >
CCR Budget reduction ~1.3% if STHM-only |
| Lancaster | $112.4M | $286.0M | 1.472× | 3.745× | 0.679% | 0.267% | Yes — 0.679% |
| Glenn Heights | $12.8M | $68.3M | 0.962× | 5.133× | 1.040% | 0.195% | No — 1.040% >
CCR Budget reduction ~3.8% if STHM-only |
| Hutchins | $30.5M | $292.5M | 1.598× | 15.321× | 0.626% | 0.065% | Yes — 0.626% |
| Seagoville | $32.0M | $109.7M | 1.522× | 5.218× | 0.657% | 0.192% | Yes — 0.657% |
| Wilmer | $63.6M | $245.2M | 2.029× | 7.823× | 0.493% | 0.128% | Yes — at SCR |
| Combine | $1.5M | $25.7M | 1.171× | 20.481× | 0.854% | 0.049% | Yes — 0.854% |
| Ferris | $8.2M | $98.9M | 1.619× | 19.526× | 0.618% | 0.051% | Yes — at SCR |
Two Estimates, One Honest Range
The tables above present two methods side by side for a reason. The STHM (Simple Transaction History Method) lower-bound anchors each city's tax base to actual recorded local sales tax collections, producing a conservative estimate of what the TPTRP tax base would generate at the SCR. The ZFAM (ZIP-spine) upper-bound allocates each city's share of the full statewide Final Taxable Base from ZIP-code-level economic activity — capturing commercial, industrial, logistics, and business-to-business transactions that the current local sales tax base entirely misses. The realistic operating outcome for any city likely lands between these two bounds. The plan is designed for both. [A-1][A-2][B-9]
Under ZFAM — the controlling method — every city in HD109 is fully funded at the 0.60% SCR with strong multiples. Under STHM at the SCR, five cities cover their direct PT+ST revenues and four fall short of the starting rate alone. That is the honest lower bound. It is not a failure of the plan; it is the expected behavior of a conservative method that does not yet capture the full transaction base. The rate architecture — including the voter-approval pathway and the constitutional ceiling — exists precisely to handle that range. [A-2][B-9]
The strongest city outcomes under ZFAM occur where industrial, warehousing, and logistics activity produces a large transaction base relative to current levies. Hutchins, Wilmer, Ferris, and Lancaster are the clearest examples: these cities attract commercial development that drives appraisals up under the current system, burdening homeowners — but under TPTRP, that same economic activity expands the tax base and directly funds city services without a property tax bill. [A-1][B-9]
What Happens If a City Comes In Short at the Starting Rate
For cities where the SCR does not fully cover existing revenues under the STHM lower bound, the constitutional rate architecture provides a transparent, voter-controlled remedy. The city council may call an election and ask voters to authorize a specific higher T3 rate above the 0.60% SCR, up to but not exceeding the 1.00% constitutional ceiling (CCR). The proposed rate and the budget plan it funds must be posted publicly before the vote. If voters approve, the new rate takes effect. If voters decline, the current rate holds and the city adjusts expenditures accordingly. [A-1][B-9]
The Rate Range table in each tab shows the minimum rate required to cover the TRO under each method. Under the standard TPTRP TRO definition (Tab 2), the minimum STHM rate for every city falls within the 1.00% CCR — the highest being Glenn Heights at 1.040%, which is fractionally above the ceiling. However, that 1.040% minimum is against the full 10% buffer target. The plan only requires a 5% working buffer. At the CCR, Glenn Heights generates $12.8M against $12.1M in total revenues — a 5.8% buffer, which clears the 5% floor. DeSoto at the CCR generates $81.2M against $74.8M in total revenues — an 8.6% buffer, also above the floor. Neither city requires a rate above the constitutional ceiling to maintain a compliant budget under the plan. [A-2][B-9]
The TRO's 10% buffer is not a hard minimum — it is the maximum surplus a city may carry without publicly reporting it as such. The plan requires cities to operate at least 5% under their projected revenues as a working margin against economic fluctuation. That means any revenue outcome between the direct PT+ST total and the TRO places the city in the acceptable operating zone: funded, buffered between 0% and 10%, and required to manage to at least 5% headroom. Cities that fall between the direct total and the TRO at the CCR are not failing — they are operating within the plan's design. [A-1]
These two cities are the only ones in HD109 where the STHM lower bound at the SCR falls materially short of total existing revenues — DeSoto at 0.651× and Glenn Heights at 0.635×. Under ZFAM (controlling), both are well-covered: DeSoto at 1.243× and Glenn Heights at 3.082× at the SCR alone, with no rate adjustment needed. In the conservative STHM case, both cities can go to voters for a rate up to the 1.00% CCR. At that ceiling, DeSoto achieves an 8.6% buffer and Glenn Heights a 5.8% buffer above their combined PT+ST revenues — both within the plan's acceptable 5%–10% operating zone. No budget cuts are required if voters approve the CCR. The honest framing is straightforward: these cities need a voter-approved rate above the SCR in the STHM scenario, the rate that resolves them is within constitutional bounds, and the buffer they land on is between the plan's floor and ceiling. [A-2][B-9]
| City | PT Rev 2025 | ST Rev 2025 | Total Tax Rev | ZIP-Spine FTB | FTB Multiplier | City TRO (PT×1.10) | SCR Rev (0.60%) | TRO SCR Coverage |
|---|---|---|---|---|---|---|---|---|
| Cedar Hill | $46.4M | $21.6M | $68.0M | $58.98B | 51.29× | $51.1M | $353.9M | 6.929× |
| DeSoto | $58.3M | $16.5M | $74.8M | $17.04B | 20.62× | $64.1M | $102.3M | 1.595× |
| Lancaster | $46.5M | $22.9M | $69.4M | $28.60B | 24.99× | $51.2M | $171.6M | 3.353× |
| Glenn Heights | $10.8M | $1.3M | $12.1M | $6.83B | 52.61× | $11.9M | $41.0M | 3.453× |
| Hutchins | $11.1M | $6.2M | $17.4M | $29.25B | 94.21× | $12.3M | $175.5M | 14.314× |
| Seagoville | $12.6M | $6.5M | $19.1M | $10.97B | 33.65× | $13.8M | $65.8M | 4.755× |
| Wilmer | $15.5M | $13.0M | $28.5M | $24.52B | 37.82× | $17.1M | $147.1M | 8.612× |
| Combine | $916K | $225K | $1.1M | $2.57B | 171.50× | $1.0M | $15.4M | 15.333× |
| Ferris | $2.9M | $1.7M | $4.6M | $9.89B | 118.90× | $3.2M | $59.3M | 18.331× |
| TOTAL | $205.0M | $89.9M | $294.9M | — | — | $225.7M | $1.13B | — |
Cedar Hill is a mature suburban city with a diversified retail and commercial base along US-67. Its 2025 property tax levy of $46.4M represents 68% of total tax revenues — a significant burden on homeowners in established neighborhoods like Highpoint and High Pointe. At the SCR of 0.60% applied to its ZIP-spine FTB of $59.0B, the city would generate $353.9M — 5.21× its total current revenues. The 10-year sales tax history shows consistent growth from 2015 to 2021, a strong post-pandemic surge through 2022, and stable plateau thereafter, reflecting Cedar Hill's position as a regional shopping destination. Had the SCR been in place throughout this period, city residents would have seen zero property tax bills every single year while the city collected multiples of its current revenues.
2025 Revenue Projections
| Metric | STHM FTB Method | ZIP-Spine FTB Method |
|---|---|---|
| Full Tax Base (FTB) | $11.3B | $59.0B |
| PT Revenue 2025 | $46,424,371 | |
| ST Revenue 2025 | $21,559,419 | |
| Total Tax Revenue 2025 | $67,983,790 | |
| City TRO (Total × 1.10) | $74,782,169 | |
| SCR Revenue (0.60%) | $67,728,311 | $353,859,303 |
| SCR Coverage vs Total Rev | 0.996× | 5.205× |
| SCR Coverage vs TRO | 0.906× | 6.929× |
| CCR Revenue (1.00%) | $112,880,519 | $589,765,504 |
| CCR Coverage vs Total Rev | 1.660× | 8.675× |
| CCR Coverage vs TRO | 1.509× | 7.886× |
10-Year History: What the SCR Would Have Generated
Historical SCR estimates use the STHM approach (annual ST allocation ÷ local rate × 9.8171 × 0.60%). PT history available 2021–2025 from PTAD; 2015–2020 shows ST-only revenues. Coverage ratio for 2015–2020 is SCR vs ST revenue only; 2021–2025 is SCR vs PT+ST.
| Year | PT Levy | ST Revenue | SCR Rev (STHM) | Coverage |
|---|---|---|---|---|
| 2015 | — | $26,782,952 | $84,137,894 | 3.14× (vs ST) |
| 2016 | — | $28,742,882 | $90,294,960 | 3.14× (vs ST) |
| 2017 | — | $29,243,192 | $91,866,670 | 3.14× (vs ST) |
| 2018 | — | $30,348,298 | $95,338,328 | 3.14× (vs ST) |
| 2019 | — | $31,314,761 | $98,374,446 | 3.14× (vs ST) |
| 2020 | — | $31,844,073 | $100,037,265 | 3.14× (vs ST) |
| 2021 | $32,512,652 | $37,197,854 | $116,856,018 | 1.68× |
| 2022 | $36,234,894 | $42,334,699 | $132,993,273 | 1.69× |
| 2023 | $39,367,762 | $42,669,681 | $134,045,607 | 1.63× |
| 2024 | $43,299,658 | $42,331,181 | $132,982,219 | 1.55× |
| 2025 | $46,424,371 | $43,118,838 | $135,456,623 | 1.51× |
Revenue Comparison Chart
DeSoto carries the highest property tax burden of any city in HD109 relative to its size — its $58.3M levy in 2025 represents 78% of total tax revenues. This reflects sustained appraisal growth driven by residential expansion along Belt Line Road and Polk Street corridors. Despite this, DeSoto has the lowest SCR coverage ratio of the nine cities at 1.37× — still fully covering its obligation with $102.3M in projected SCR revenue against a TRO of $82.3M. The 10-year record shows DeSoto's sales tax base grew steadily even during the 2020 pandemic year, and the STHM-based historical SCR analysis confirms the plan would have been revenue-positive every year from 2015 onward.
2025 Revenue Projections
| Metric | STHM FTB Method | ZIP-Spine FTB Method |
|---|---|---|
| Full Tax Base (FTB) | $8.1B | $17.0B |
| PT Revenue 2025 | $58,268,438 | |
| ST Revenue 2025 | $16,532,448 | |
| Total Tax Revenue 2025 | $74,800,886 | |
| City TRO (Total × 1.10) | $82,280,975 | |
| SCR Revenue (0.60%) | $48,690,209 | $102,257,607 |
| SCR Coverage vs Total Rev | 0.651× | 1.367× |
| SCR Coverage vs TRO | 0.592× | 1.595× |
| CCR Revenue (1.00%) | $81,150,349 | $170,429,345 |
| CCR Coverage vs Total Rev | 1.085× | 2.278× |
| CCR Coverage vs TRO | 0.986× | 2.071× |
10-Year History: What the SCR Would Have Generated
Historical SCR estimates use the STHM approach (annual ST allocation ÷ local rate × 9.8171 × 0.60%). PT history available 2021–2025 from PTAD; 2015–2020 shows ST-only revenues. Coverage ratio for 2015–2020 is SCR vs ST revenue only; 2021–2025 is SCR vs PT+ST.
| Year | PT Levy | ST Revenue | SCR Rev (STHM) | Coverage |
|---|---|---|---|---|
| 2015 | — | $23,671,082 | $69,714,414 | 2.95× (vs ST) |
| 2016 | — | $23,813,515 | $70,133,898 | 2.95× (vs ST) |
| 2017 | — | $24,543,222 | $72,282,980 | 2.95× (vs ST) |
| 2018 | — | $27,207,126 | $80,128,524 | 2.95× (vs ST) |
| 2019 | — | $27,931,185 | $82,260,970 | 2.95× (vs ST) |
| 2020 | — | $31,154,004 | $91,752,591 | 2.95× (vs ST) |
| 2021 | $38,915,679 | $35,556,252 | $104,717,784 | 1.41× |
| 2022 | $44,345,530 | $33,387,073 | $98,329,270 | 1.26× |
| 2023 | $49,538,690 | $29,940,149 | $88,177,630 | 1.11× |
| 2024 | $54,353,390 | $30,978,143 | $91,234,659 | 1.07× |
| 2025 | $58,268,438 | $33,064,896 | $97,380,419 | 1.07× |
Revenue Comparison Chart
Lancaster has undergone the most dramatic property tax growth of all HD109 cities — a 160%+ increase since 2015 driven by major industrial and logistics development in its I-20 corridor. The 2025 PT levy of $46.5M now accounts for 67% of total city tax revenues. Under TPTRP, Lancaster's $28.6B ZIP-spine FTB produces $171.6M in SCR revenue — 2.47× its total revenues and 2.25× its TRO. Lancaster's industrial growth that has driven appraisals up also expands the economic activity base, meaning the TPTRP actually rewards cities like Lancaster that attract commercial development rather than punishing their residents through rising appraisals.
2025 Revenue Projections
| Metric | STHM FTB Method | ZIP-Spine FTB Method |
|---|---|---|
| Full Tax Base (FTB) | $11.2B | $28.6B |
| PT Revenue 2025 | $46,530,435 | |
| ST Revenue 2025 | $22,889,699 | |
| Total Tax Revenue 2025 | $69,420,134 | |
| City TRO (Total × 1.10) | $76,362,147 | |
| SCR Revenue (0.60%) | $67,413,139 | $171,610,321 |
| SCR Coverage vs Total Rev | 0.971× | 2.472× |
| SCR Coverage vs TRO | 0.883× | 3.353× |
| CCR Revenue (1.00%) | $112,355,232 | $286,017,202 |
| CCR Coverage vs Total Rev | 1.618× | 4.120× |
| CCR Coverage vs TRO | 1.471× | 3.746× |
10-Year History: What the SCR Would Have Generated
Historical SCR estimates use the STHM approach (annual ST allocation ÷ local rate × 9.8171 × 0.60%). PT history available 2021–2025 from PTAD; 2015–2020 shows ST-only revenues. Coverage ratio for 2015–2020 is SCR vs ST revenue only; 2021–2025 is SCR vs PT+ST.
| Year | PT Levy | ST Revenue | SCR Rev (STHM) | Coverage |
|---|---|---|---|---|
| 2015 | — | $17,633,006 | $51,931,496 | 2.95× (vs ST) |
| 2016 | — | $18,226,787 | $53,680,258 | 2.95× (vs ST) |
| 2017 | — | $19,846,942 | $58,451,824 | 2.95× (vs ST) |
| 2018 | — | $23,061,436 | $67,918,926 | 2.95× (vs ST) |
| 2019 | — | $22,023,824 | $64,863,024 | 2.95× (vs ST) |
| 2020 | — | $20,926,787 | $61,632,109 | 2.95× (vs ST) |
| 2021 | $28,252,420 | $25,567,520 | $75,299,671 | 1.40× |
| 2022 | $31,197,602 | $37,840,404 | $111,444,910 | 1.61× |
| 2023 | $34,922,160 | $41,310,590 | $121,665,059 | 1.60× |
| 2024 | $40,047,673 | $46,158,091 | $135,941,579 | 1.58× |
| 2025 | $46,530,435 | $45,779,398 | $134,826,278 | 1.46× |
Revenue Comparison Chart
Glenn Heights straddles Dallas and Ellis counties, giving it a unique dual-county tax profile. Its local sales tax rate is 1.00% — the lowest of any HD109 city — limiting current sales tax revenue but not limiting its economic footprint. The ZIP-spine FTB of $6.8B captures full economic activity across both county portions of the city and produces $41.0M in SCR revenue, 3.39× current revenues. Glenn Heights' modest current sales tax base relative to its ZIP-spine FTB illustrates precisely why the ZIP-spine approach is superior: the city hosts significant economic activity — shopping, services, and pass-through commerce on US-67 — that never shows up in Comptroller allocations.
2025 Revenue Projections
| Metric | STHM FTB Method | ZIP-Spine FTB Method |
|---|---|---|
| Full Tax Base (FTB) | $1.3B | $6.8B |
| PT Revenue 2025 | $10,796,912 | |
| ST Revenue 2025 | $1,299,101 | |
| Total Tax Revenue 2025 | $12,096,013 | |
| City TRO (Total × 1.10) | $13,305,614 | |
| SCR Revenue (0.60%) | $7,652,041 | $41,009,885 |
| SCR Coverage vs Total Rev | 0.633× | 3.390× |
| SCR Coverage vs TRO | 0.575× | 3.453× |
| CCR Revenue (1.00%) | $12,753,402 | $68,349,808 |
| CCR Coverage vs Total Rev | 1.054× | 5.651× |
| CCR Coverage vs TRO | 0.958× | 5.137× |
10-Year History: What the SCR Would Have Generated
Historical SCR estimates use the STHM approach (annual ST allocation ÷ local rate × 9.8171 × 0.60%). PT history available 2021–2025 from PTAD; 2015–2020 shows ST-only revenues. Coverage ratio for 2015–2020 is SCR vs ST revenue only; 2021–2025 is SCR vs PT+ST.
| Year | PT Levy | ST Revenue | SCR Rev (STHM) | Coverage |
|---|---|---|---|---|
| 2015 | — | $1,051,361 | $6,192,789 | 5.89× (vs ST) |
| 2016 | — | $1,037,365 | $6,110,350 | 5.89× (vs ST) |
| 2017 | — | $1,067,695 | $6,288,999 | 5.89× (vs ST) |
| 2018 | — | $1,219,018 | $7,180,334 | 5.89× (vs ST) |
| 2019 | — | $1,446,545 | $8,520,524 | 5.89× (vs ST) |
| 2020 | — | $1,667,501 | $9,822,017 | 5.89× (vs ST) |
| 2021 | $8,300,464 | $1,910,343 | $11,252,414 | 1.10× |
| 2022 | $9,019,564 | $2,035,051 | $11,986,979 | 1.08× |
| 2023 | $9,489,442 | $2,290,930 | $13,494,173 | 1.15× |
| 2024 | $10,265,708 | $2,546,234 | $14,997,983 | 1.17× |
| 2025 | $10,796,912 | $2,598,202 | $15,304,082 | 1.14× |
Revenue Comparison Chart
Hutchins is the industrial powerhouse of HD109. Its 2.00% city sales tax rate captures revenue from a massive logistics and warehousing complex along I-45 South, but the current tax base captures only a fraction of full economic throughput. The ZIP-spine FTB of $29.2B — nearly 9.6× the STHM estimate — reflects the enormous volume of wholesale, distribution, and commercial activity that flows through Hutchins' industrial parks but is largely invisible to the current narrow sales tax base. SCR revenue of $175.5M represents 10.11× current city revenues. Hutchins homeowners pay property taxes to fund city services while sitting next to facilities that generate billions in economic activity — TPTRP redirects that value back to the city and its residents.
2025 Revenue Projections
| Metric | STHM FTB Method | ZIP-Spine FTB Method |
|---|---|---|
| Full Tax Base (FTB) | $3.0B | $29.2B |
| PT Revenue 2025 | $11,145,891 | |
| ST Revenue 2025 | $6,209,527 | |
| Total Tax Revenue 2025 | $17,355,418 | |
| City TRO (Total × 1.10) | $19,090,960 | |
| SCR Revenue (0.60%) | $18,287,865 | $175,492,656 |
| SCR Coverage vs Total Rev | 1.054× | 10.112× |
| SCR Coverage vs TRO | 0.958× | 14.314× |
| CCR Revenue (1.00%) | $30,479,775 | $292,487,759 |
| CCR Coverage vs Total Rev | 1.756× | 16.853× |
| CCR Coverage vs TRO | 1.597× | 15.321× |
10-Year History: What the SCR Would Have Generated
Historical SCR estimates use the STHM approach (annual ST allocation ÷ local rate × 9.8171 × 0.60%). PT history available 2021–2025 from PTAD; 2015–2020 shows ST-only revenues. Coverage ratio for 2015–2020 is SCR vs ST revenue only; 2021–2025 is SCR vs PT+ST.
| Year | PT Levy | ST Revenue | SCR Rev (STHM) | Coverage |
|---|---|---|---|---|
| 2015 | — | $4,171,787 | $12,286,456 | 2.95× (vs ST) |
| 2016 | — | $4,816,323 | $14,184,698 | 2.95× (vs ST) |
| 2017 | — | $5,048,356 | $14,868,064 | 2.95× (vs ST) |
| 2018 | — | $5,162,584 | $15,204,482 | 2.95× (vs ST) |
| 2019 | — | $5,912,755 | $17,413,833 | 2.95× (vs ST) |
| 2020 | — | $6,764,635 | $19,922,730 | 2.95× (vs ST) |
| 2021 | $5,516,182 | $8,388,284 | $24,704,587 | 1.78× |
| 2022 | $6,672,628 | $10,645,483 | $31,352,332 | 1.81× |
| 2023 | $7,826,073 | $12,261,594 | $36,111,987 | 1.80× |
| 2024 | $9,779,018 | $11,530,141 | $33,957,763 | 1.59× |
| 2025 | $11,145,891 | $12,419,055 | $36,575,730 | 1.55× |
Revenue Comparison Chart
Seagoville is a working-class residential community with a growing commercial presence along Hwy 175. Its 2025 property and sales tax revenues total $19.1M, with the PT levy comprising 66% of that amount. The ZIP-spine FTB of $11.0B produces SCR revenue of $65.8M — 3.45× current revenues — reflecting commercial activity in the Seagoville/Balch Springs area captured by ZIP 75159. The 10-year sales tax history shows steady, uninterrupted growth with a significant acceleration beginning in 2021, consistent with broader Dallas County suburban growth patterns. Under TPTRP, Seagoville residents eliminate their annual property tax bills while the city's finances improve substantially.
2025 Revenue Projections
| Metric | STHM FTB Method | ZIP-Spine FTB Method |
|---|---|---|
| Full Tax Base (FTB) | $3.2B | $11.0B |
| PT Revenue 2025 | $12,589,581 | |
| ST Revenue 2025 | $6,522,821 | |
| Total Tax Revenue 2025 | $19,112,402 | |
| City TRO (Total × 1.10) | $21,023,642 | |
| SCR Revenue (0.60%) | $19,210,556 | $65,849,079 |
| SCR Coverage vs Total Rev | 1.005× | 3.445× |
| SCR Coverage vs TRO | 0.914× | 4.755× |
| CCR Revenue (1.00%) | $32,017,594 | $109,748,464 |
| CCR Coverage vs Total Rev | 1.675× | 5.742× |
| CCR Coverage vs TRO | 1.523× | 5.220× |
10-Year History: What the SCR Would Have Generated
Historical SCR estimates use the STHM approach (annual ST allocation ÷ local rate × 9.8171 × 0.60%). PT history available 2021–2025 from PTAD; 2015–2020 shows ST-only revenues. Coverage ratio for 2015–2020 is SCR vs ST revenue only; 2021–2025 is SCR vs PT+ST.
| Year | PT Levy | ST Revenue | SCR Rev (STHM) | Coverage |
|---|---|---|---|---|
| 2015 | — | $5,487,901 | $16,162,581 | 2.95× (vs ST) |
| 2016 | — | $5,769,309 | $16,991,366 | 2.95× (vs ST) |
| 2017 | — | $6,360,907 | $18,733,697 | 2.95× (vs ST) |
| 2018 | — | $6,994,901 | $20,600,892 | 2.95× (vs ST) |
| 2019 | — | $7,438,164 | $21,906,361 | 2.95× (vs ST) |
| 2020 | — | $7,833,977 | $23,072,081 | 2.95× (vs ST) |
| 2021 | $7,369,579 | $9,134,662 | $26,902,767 | 1.63× |
| 2022 | $8,839,079 | $10,838,590 | $31,921,057 | 1.62× |
| 2023 | $9,551,767 | $11,267,067 | $33,182,978 | 1.59× |
| 2024 | $10,512,298 | $12,094,857 | $35,620,926 | 1.58× |
| 2025 | $12,589,581 | $13,045,642 | $38,421,112 | 1.50× |
Revenue Comparison Chart
Wilmer has experienced the most explosive property tax growth in HD109 — over 2,300% from 2015 to 2025 — driven by massive Amazon and logistics facility development along I-45. This growth has been a windfall for appraisal districts and a burden for the handful of homeowners who share the tax base with industrial titans. The ZIP-spine FTB of $24.5B reflects this industrial density, producing $147.1M in SCR revenue — 5.16× Wilmer's current revenues. Under TPTRP, the economic activity generated by those massive facilities directly funds city services and eliminates homeowner tax bills, instead of simply inflating appraisals.
2025 Revenue Projections
| Metric | STHM FTB Method | ZIP-Spine FTB Method |
|---|---|---|
| Full Tax Base (FTB) | $6.4B | $24.5B |
| PT Revenue 2025 | $15,528,723 | |
| ST Revenue 2025 | $12,965,130 | |
| Total Tax Revenue 2025 | $28,493,853 | |
| City TRO (Total × 1.10) | $31,343,239 | |
| SCR Revenue (0.60%) | $38,183,994 | $147,108,275 |
| SCR Coverage vs Total Rev | 1.340× | 5.163× |
| SCR Coverage vs TRO | 1.218× | 8.612× |
| CCR Revenue (1.00%) | $63,639,990 | $245,180,458 |
| CCR Coverage vs Total Rev | 2.233× | 8.605× |
| CCR Coverage vs TRO | 2.030× | 7.822× |
10-Year History: What the SCR Would Have Generated
Historical SCR estimates use the STHM approach (annual ST allocation ÷ local rate × 9.8171 × 0.60%). PT history available 2021–2025 from PTAD; 2015–2020 shows ST-only revenues. Coverage ratio for 2015–2020 is SCR vs ST revenue only; 2021–2025 is SCR vs PT+ST.
| Year | PT Levy | ST Revenue | SCR Rev (STHM) | Coverage |
|---|---|---|---|---|
| 2015 | — | $1,047,686 | $3,085,572 | 2.95× (vs ST) |
| 2016 | — | $2,768,624 | $8,153,958 | 2.95× (vs ST) |
| 2017 | — | $7,436,895 | $21,902,621 | 2.95× (vs ST) |
| 2018 | — | $7,814,892 | $23,015,872 | 2.95× (vs ST) |
| 2019 | — | $9,498,189 | $27,973,402 | 2.95× (vs ST) |
| 2020 | — | $11,603,973 | $34,175,209 | 2.95× (vs ST) |
| 2021 | $4,675,652 | $15,900,360 | $46,828,627 | 2.28× |
| 2022 | $6,309,454 | $19,360,308 | $57,018,623 | 2.22× |
| 2023 | $7,798,981 | $24,467,401 | $72,059,678 | 2.23× |
| 2024 | $10,153,343 | $24,027,151 | $70,763,083 | 2.07× |
| 2025 | $15,528,723 | $25,930,260 | $76,367,988 | 1.84× |
Revenue Comparison Chart
Combine is HD109's smallest incorporated city — a rural residential community on the Dallas-Kaufman county line. Its 1.50% local sales tax generates modest revenue from highway-adjacent commercial activity, but the ZIP-spine FTB of $2.6B captures the full economic throughput of ZIP 75159, which includes commercial corridors extending well beyond Combine proper. SCR revenue of $15.4M is 13.54× current city revenues — the highest coverage ratio in HD109 — because Combine's current tax base dramatically understates actual economic activity in its geography. Small cities like Combine, which have very limited property tax bases, benefit most visibly from TPTRP.
2025 Revenue Projections
| Metric | STHM FTB Method | ZIP-Spine FTB Method |
|---|---|---|
| Full Tax Base (FTB) | $147.3M | $2.6B |
| PT Revenue 2025 | $915,623 | |
| ST Revenue 2025 | $225,118 | |
| Total Tax Revenue 2025 | $1,140,741 | |
| City TRO (Total × 1.10) | $1,254,815 | |
| SCR Revenue (0.60%) | $884,003 | $15,443,199 |
| SCR Coverage vs Total Rev | 0.775× | 13.538× |
| SCR Coverage vs TRO | 0.704× | 15.333× |
| CCR Revenue (1.00%) | $1,473,338 | $25,738,665 |
| CCR Coverage vs Total Rev | 1.292× | 22.563× |
| CCR Coverage vs TRO | 1.174× | 20.512× |
10-Year History: What the SCR Would Have Generated
Historical SCR estimates use the STHM approach (annual ST allocation ÷ local rate × 9.8171 × 0.60%). PT history available 2021–2025 from PTAD; 2015–2020 shows ST-only revenues. Coverage ratio for 2015–2020 is SCR vs ST revenue only; 2021–2025 is SCR vs PT+ST.
| Year | PT Levy | ST Revenue | SCR Rev (STHM) | Coverage |
|---|---|---|---|---|
| 2015 | — | $100,590 | $395,001 | 3.93× (vs ST) |
| 2016 | — | $117,818 | $462,651 | 3.93× (vs ST) |
| 2017 | — | $130,260 | $511,510 | 3.93× (vs ST) |
| 2018 | — | $135,614 | $532,535 | 3.93× (vs ST) |
| 2019 | — | $171,866 | $674,889 | 3.93× (vs ST) |
| 2020 | — | $243,196 | $954,994 | 3.93× (vs ST) |
| 2021 | $540,875 | $296,415 | $1,163,973 | 1.39× |
| 2022 | $659,529 | $335,657 | $1,318,072 | 1.32× |
| 2023 | $769,274 | $378,846 | $1,487,666 | 1.30× |
| 2024 | $834,648 | $411,146 | $1,614,504 | 1.30× |
| 2025 | $915,623 | $450,236 | $1,768,006 | 1.29× |
Revenue Comparison Chart
Ferris is an Ellis County community on I-45 South experiencing rapid industrial growth, with major distribution centers and industrial parks driving appraisal increases since 2020. Its 2025 property tax levy of $2.9M reflects this surge. The ZIP-spine FTB of $9.9B captures the full Ellis County I-45 corridor economic activity, producing $59.3M in SCR revenue — 12.88× current revenues and 11.71× the TRO. Like Hutchins and Wilmer, Ferris illustrates how industrial development that raises property appraisals — and burdens homeowners — is transformed under TPTRP into a resource that directly funds city services without cost to residents.
2025 Revenue Projections
| Metric | STHM FTB Method | ZIP-Spine FTB Method |
|---|---|---|
| Full Tax Base (FTB) | $816.3M | $9.9B |
| PT Revenue 2025 | $2,941,707 | |
| ST Revenue 2025 | $1,662,956 | |
| Total Tax Revenue 2025 | $4,604,663 | |
| City TRO (Total × 1.10) | $5,065,129 | |
| SCR Revenue (0.60%) | $4,897,621 | $59,316,296 |
| SCR Coverage vs Total Rev | 1.064× | 12.882× |
| SCR Coverage vs TRO | 0.967× | 18.331× |
| CCR Revenue (1.00%) | $8,162,702 | $98,860,494 |
| CCR Coverage vs Total Rev | 1.773× | 21.470× |
| CCR Coverage vs TRO | 1.612× | 19.518× |
10-Year History: What the SCR Would Have Generated
Historical SCR estimates use the STHM approach (annual ST allocation ÷ local rate × 9.8171 × 0.60%). PT history available 2021–2025 from PTAD; 2015–2020 shows ST-only revenues. Coverage ratio for 2015–2020 is SCR vs ST revenue only; 2021–2025 is SCR vs PT+ST.
| Year | PT Levy | ST Revenue | SCR Rev (STHM) | Coverage |
|---|---|---|---|---|
| 2015 | — | $921,254 | $2,713,212 | 2.95× (vs ST) |
| 2016 | — | $843,805 | $2,485,116 | 2.95× (vs ST) |
| 2017 | — | $950,650 | $2,799,789 | 2.95× (vs ST) |
| 2018 | — | $1,159,313 | $3,414,327 | 2.95× (vs ST) |
| 2019 | — | $1,281,029 | $3,772,797 | 2.95× (vs ST) |
| 2020 | — | $1,533,010 | $4,514,915 | 2.95× (vs ST) |
| 2021 | $1,933,035 | $1,731,029 | $5,098,106 | 1.39× |
| 2022 | $2,370,575 | $2,174,314 | $6,403,638 | 1.41× |
| 2023 | $1,977,172 | $2,827,672 | $8,327,863 | 1.73× |
| 2024 | $2,383,830 | $3,175,997 | $9,353,725 | 1.68× |
| 2025 | $2,941,707 | $3,325,912 | $9,795,243 | 1.56× |
Revenue Comparison Chart
City Methodology
Your School District: Fully Funded — Without Property Taxes
Cedar Hill ISD, DeSoto ISD, and Lancaster ISD each see their property tax levy eliminated and their full funding replaced under Tier 4.
Three additional ISDs serve HD109 communities and are fully covered under the same Tier 4 framework: Dallas ISD, which serves Hutchins, Wilmer, and the Seagoville area following the 2014 and 2006 consolidations of Seagoville ISD and Wilmer-Hutchins ISD; Red Oak ISD, which serves the Ellis County portion of Glenn Heights; and Ferris ISD, which serves Ferris. Combine, Texas is served by two separate ISDs — Dallas ISD (Dallas County residents) and Crandall ISD (Kaufman County residents) — and is addressed separately below. Full certified data for Dallas ISD, Red Oak ISD, and Ferris ISD is available in the HD109 TPTRP Workbook v9 and in the city-specific impact articles for each community. [A-3][E-1]
School funding is the most emotionally charged part of any property tax debate — and the most important to get right. The TPTRP does not reduce school funding by a single dollar. Instead, it replaces the local property tax levy with a Tier 4 sales tax whose Total Replacement Obligation already incorporates each ISD’s share of current state Foundation School Program (FSP) funding — producing a fully integrated, single-source revenue model that is more stable and more equitable than the current property-tax-dependent system.
Today, ISDs raise the majority of their operations revenue through local M&O property taxes. The state provides a supplemental contribution through the FSP to equalize funding across wealthy and less-wealthy districts. Under the TPTRP, the local property tax is eliminated and replaced by the ISD's share of a 1.20% T4 sales tax — generating far more revenue than the eliminated levy in every HD109 district.
| ISD | Current PT Levy | ISD TRO | Tier-4 TRO | STHM Proxy FTB | SCR Revenue (1.20%) | Coverage vs ISD TRO | Coverage vs Tier-4 TRO | ADA (2025-26) |
|---|---|---|---|---|---|---|---|---|
| Cedar Hill ISD | $63,467,498 | $69,814,248 | $101,308,920 | $11.29B | $135,480,000 | 1.940× | 1.337× | 5,615 |
| DeSoto ISD | $56,564,112 | $62,220,523 | $91,043,805 | $9.40B | $112,800,000 | 1.813× | 1.239× | 5,138 |
| Lancaster ISD | $75,745,789 | $83,320,368 | $116,836,666 | $14.29B | $171,480,000 | 2.057× | 1.468× | 5,975 |
| Dallas ISD (Hutchins · Wilmer · Seagoville) | $1,952,642,325 | $2,147,906,558 | $2,837,328,448 | N/A (ZFAM only) | See ZFAM tab | — | — | 122,906 |
| Red Oak ISD (Glenn Heights — Ellis Co.) | $47,559,612 | $52,315,573 | $87,063,712 | N/A (ZFAM only) | See ZFAM tab | — | — | 6,195 |
| Ferris ISD (Ferris) | $13,735,832 | $15,109,415 | $30,498,718 | N/A (ZFAM only) | See ZFAM tab | — | — | 2,744 |
| Combine | Cross-county split: Dallas ISD + Crandall ISD. See ZFAM tab and Combine city article. | |||||||
| ISD | Current PT Levy | ISD TRO | Tier-4 TRO | ZFAM FTB | SCR Revenue (1.20%) | SCR Coverage vs ISD TRO | SCR Coverage vs Tier-4 TRO | ADA (2025-26) |
|---|---|---|---|---|---|---|---|---|
| Cedar Hill ISD | $63,467,498 | $69,814,248 | $101,308,920 | $35.71B | $428,519,077 | 6.138× | 4.230× | 5,615 |
| DeSoto ISD | $56,564,112 | $62,220,523 | $91,043,805 | $14.79B | $177,425,949 | 2.852× | 1.949× | 5,138 |
| Lancaster ISD | $75,745,789 | $83,320,368 | $116,836,666 | $33.56B | $402,730,746 | 4.834× | 3.447× | 5,975 |
| Dallas ISD (Hutchins · Wilmer · Seagoville) | $1,952,642,325 | $2,147,906,558 | $2,837,328,448 | $349.1B | $4,189,357,541 | 1.950× | 1.477× | 122,906 |
| Red Oak ISD (Glenn Heights — Ellis Co.) | $47,559,612 | $52,315,573 | $87,063,712 | $28.8B | $345,746,651 | 6.609× | 3.971× | 6,195 |
| Ferris ISD (Ferris) | $13,735,832 | $15,109,415 | $30,498,718 | $36.6B | $438,828,458 | 29.043× | 14.388× | 2,744 |
| Combine (Dallas ISD + Crandall ISD — cross-county split) | Dallas County residents → Dallas ISD (see above). Kaufman County residents → Crandall ISD (CDN 129901, rate $1.2869/$100). No single ISD serves all Combine residents; data not combined — see Combine city article. | |||||||
The Numbers Are Unambiguous
Every HD109 school district is fully covered at the T4 starting rate in the current workbook. Among the three original HD109 ISDs, Cedar Hill ISD posts the strongest coverage at 6.138×, while DeSoto ISD is fully covered at 2.852×. Dallas ISD (1.950×), Red Oak ISD (6.609×), and Ferris ISD (29.043× — the highest of any ISD in the dataset) are all fully covered under the same Tier 4 framework. [A-3][E-1]
This result follows from the ZIP-based allocation method used in the workbook, which assigns each district a share of the statewide transaction base large enough to replace the local levy at the Tier 4 starting rate. [A-1][G-1][G-5]
"The school funding problem in Texas is not that there isn't enough money. It's that the money is locked inside property values instead of flowing through the economy."— Rep. Will Campbell, HD109
State FSP Funding Is Embedded in the Tier-4 TRO
The Tier-4 TRO is a composite obligation — it includes both the ISD’s local property tax levy (×1.10 buffer) and the ISD’s proportional share of current state Foundation School Program (FSP) funding, which flows from T1 through an education reallocation mechanism. This is why the summary table shows two TRO rows: ISD TRO (levy-only replacement) and Tier-4 TRO (the full combined obligation including the FSP reallocation share). Under the plan, the state’s FSP contribution continues to flow to ISDs — it simply originates from T1 SCR revenue rather than from property taxes. No district loses a dollar of state education funding. [E-1]
| ISD | PT Levy 2025 | ZIP-Spine FTB | ISD TRO | SCR Rev (1.20%) | CCR Rev (1.50%) | TRO SCR Coverage |
|---|---|---|---|---|---|---|
| Cedar Hill ISD | $63,467,498 | $35.7B | $69,814,248 | $428,519,077 | $535,648,846 | 6.138× |
| DeSoto ISD | $56,564,112 | $14.8B | $62,220,523 | $177,425,949 | $221,782,436 | 2.852× |
| Lancaster ISD | $75,745,789 | $33.6B | $83,320,368 | $402,730,746 | $503,413,432 | 4.834× |
| Dallas ISD (Hutchins · Wilmer · Seagoville) | $1,952,642,325 | $349.1B | $2,147,906,558 | $4,189,357,541 | $5,236,696,927 | 1.950× |
| Red Oak ISD (Glenn Heights — Ellis Co.) | $47,559,612 | $28.8B | $52,315,573 | $345,746,651 | $432,183,314 | 6.609× |
| Ferris ISD (Ferris) | $13,735,832 | $36.6B | $15,109,415 | $438,828,458 | $548,535,572 | 29.043× |
| Combine | Cross-county split: Dallas ISD (Dallas Co.) + Crandall ISD (Kaufman Co.). See Dallas ISD tab and Combine city article. | |||||
| TOTAL | $195,777,399 | — | $215,355,139 | $1,008,675,771 | $1,260,844,714 | — |
Cedar Hill ISD serves 5,615 students across its K-12 campuses with a 2025 property tax levy of $63.5M. Under TPTRP, the district's TRO of $69.8M is covered by SCR revenue of $428.5M — 6.14× the obligation — from its ZIP-spine FTB of $35.7B. The Tier-4 TRO of $101.3M (which includes Cedar Hill ISD's share of the state's education reallocation pool) is covered at 4.23× under the SCR. Cedar Hill ISD has operated under the Chapter 49 recapture system, sending funds out of district even as its local tax base has grown. TPTRP eliminates recapture entirely and replaces it with a funding structure that keeps education revenue in the communities that generate it.
2025 Revenue Projections
| Metric | Value |
|---|---|
| PT Revenue 2025 | $63,467,498 |
| TRO Multiplier | 1.10× |
| ISD TRO (PT × 1.10) | $69,814,248 |
| Ed Realloc Share | $31,494,672 |
| Tier-4 TRO (TRO + Ed Realloc) | $101,308,920 |
| ZIP-Spine FTB | $35.7B |
| ADA 2025-26 | 5,615 |
| WADA 2025-26 | 7,683 |
| SCR Revenue (1.20%) | $428,519,077 |
| SCR Coverage vs ISD TRO | 6.138× |
| SCR Coverage vs Tier-4 TRO | 4.230× |
| CCR Revenue (1.50%) | $535,648,846 |
| CCR Coverage vs ISD TRO | 7.672× |
| CCR Coverage vs Tier-4 TRO | 5.287× |
Revenue Comparison Chart
DeSoto ISD serves 5,138 students with a 2025 property tax levy of $56.6M. The district's growing residential enrollment and aging facilities have driven steady levy increases over the past decade. Under TPTRP, the district's TRO of $62.2M is covered at 2.85× under the SCR of 1.20%, generating $177.4M against its ZIP-spine FTB of $14.8B. DeSoto ISD has the lowest coverage ratio of the three ISDs, reflecting that its ZIP geography captures less commercial throughput than Cedar Hill or Lancaster. However, it remains fully covered with significant surplus even at the SCR, and the CCR at 1.50% provides $221.8M — 3.56× the TRO. No school district in HD109 faces a funding shortfall under any TPTRP rate scenario.
2025 Revenue Projections
| Metric | Value |
|---|---|
| PT Revenue 2025 | $56,564,112 |
| TRO Multiplier | 1.10× |
| ISD TRO (PT × 1.10) | $62,220,523 |
| Ed Realloc Share | $28,823,282 |
| Tier-4 TRO (TRO + Ed Realloc) | $91,043,805 |
| ZIP-Spine FTB | $14.8B |
| ADA 2025-26 | 5,138 |
| WADA 2025-26 | 7,157 |
| SCR Revenue (1.20%) | $177,425,949 |
| SCR Coverage vs ISD TRO | 2.852× |
| SCR Coverage vs Tier-4 TRO | 1.949× |
| CCR Revenue (1.50%) | $221,782,436 |
| CCR Coverage vs ISD TRO | 3.564× |
| CCR Coverage vs Tier-4 TRO | 2.436× |
Revenue Comparison Chart
Lancaster ISD serves 5,975 students — the largest enrollment of the three HD109 ISDs — with a 2025 property tax levy of $75.7M. The district's I-20 corridor industrial expansion has dramatically increased its taxable value over the past decade, triggering recapture obligations even as classroom needs have grown. Under TPTRP, Lancaster ISD generates $402.7M in SCR revenue from its $33.6B ZIP-spine FTB — 4.83× its TRO of $83.3M. The Tier-4 TRO of $116.8M is covered at 3.45×. Lancaster ISD benefits particularly from TPTRP because the plan captures the full economic value of the Inland Port/I-20 industrial corridor — value that currently drives up appraisals and triggers recapture — and redirects it to fund education without taxing property owners.
2025 Revenue Projections
| Metric | Value |
|---|---|
| PT Revenue 2025 | $75,745,789 |
| TRO Multiplier | 1.10× |
| ISD TRO (PT × 1.10) | $83,320,368 |
| Ed Realloc Share | $33,516,298 |
| Tier-4 TRO (TRO + Ed Realloc) | $116,836,666 |
| ZIP-Spine FTB | $33.6B |
| ADA 2025-26 | 5,975 |
| WADA 2025-26 | 8,735 |
| SCR Revenue (1.20%) | $402,730,746 |
| SCR Coverage vs ISD TRO | 4.834× |
| SCR Coverage vs Tier-4 TRO | 3.447× |
| CCR Revenue (1.50%) | $503,413,432 |
| CCR Coverage vs ISD TRO | 6.042× |
| CCR Coverage vs Tier-4 TRO | 4.309× |
Revenue Comparison Chart
Dallas ISD is the largest school district in HD109 and one of the largest in Texas, serving Hutchins, Wilmer, and Seagoville through the Wilmer-Hutchins feeder pattern and Seagoville-area schools following the 2006 consolidation of Wilmer-Hutchins ISD and 2014 consolidation of Seagoville ISD. With a certified taxable value of $198.5B and a ZFAM FTB of $349.1B, Dallas ISD's Tier 4 SCR revenue of $4.19B covers its ISD TRO at 1.950× — meaning the plan generates nearly twice what's needed to replace the district's property tax levy at the starting rate. The district's enormous FTB reflects the full economic activity of the Dallas metro area flowing through its ZIP codes.
2025 Revenue Projections
| Metric | Value |
|---|---|
| PT Revenue 2025 | $1,952,642,325 |
| M&O Rate | $0.7518/$100 |
| I&S Rate | $0.2420/$100 |
| Total Rate | $0.9938/$100 |
| Certified TV | $198,514,827,514 |
| TRO Multiplier | 1.10× |
| ISD TRO (PT × 1.10) | $2,147,906,558 |
| Ed Realloc Share | $689,421,890 |
| Tier-4 TRO (TRO + Ed Realloc) | $2,837,328,448 |
| ZFAM FTB | $349.1B |
| ADA 2025-26 | 122,905.88 |
| WADA 2025-26 | 192,851.954 |
| SCR Revenue (1.20%) | $4,189,357,541 |
| SCR Coverage vs ISD TRO | 1.950× |
| SCR Coverage vs Tier-4 TRO | 1.477× |
| CCR Revenue (1.50%) | $5,236,696,927 |
| CCR Coverage vs ISD TRO | 2.438× |
| CCR Coverage vs Tier-4 TRO | 1.846× |
Revenue Comparison Chart
Red Oak ISD serves the Ellis County portion of Glenn Heights — the eastern half of the city that falls across the Dallas/Ellis county line. With a ZFAM FTB of $28.8B and an ISD TRO of $52.3M, Red Oak ISD's SCR revenue of $345.7M covers the ISD TRO at 6.609× — one of the strongest coverage ratios of any ISD in the HD109 dataset. The district serves 6,195 students and operates at a total rate of $1.0633 per $100 AV. Red Oak ISD is not subject to recapture; the TPTRP eliminates recapture exposure entirely.
2025 Revenue Projections
| Metric | Value |
|---|---|
| PT Revenue 2025 | $47,559,612 |
| M&O Rate | $0.7152/$100 |
| I&S Rate | $0.3481/$100 |
| Total Rate | $1.0633/$100 |
| TRO Multiplier | 1.10× |
| ISD TRO (PT × 1.10) | $52,315,573 |
| Ed Realloc Share | $34,748,139 |
| Tier-4 TRO (TRO + Ed Realloc) | $87,063,712 |
| ZFAM FTB | $28.8B |
| ADA 2025-26 | 6,194.68 |
| WADA 2025-26 | 8,792.826 |
| SCR Revenue (1.20%) | $345,746,651 |
| SCR Coverage vs ISD TRO | 6.609× |
| SCR Coverage vs Tier-4 TRO | 3.971× |
| CCR Revenue (1.50%) | $432,183,314 |
| CCR Coverage vs ISD TRO | 8.261× |
| CCR Coverage vs Tier-4 TRO | 4.964× |
Revenue Comparison Chart
Ferris ISD serves the city of Ferris in Ellis County and posts the highest ISD coverage ratio in the entire HD109 dataset: 29.043× ISD TRO at the starting SCR rate. With a ZFAM FTB of $36.6B against an ISD TRO of only $15.1M, the plan generates $438.8M in SCR revenue — nearly 30 times the replacement obligation. Note: TY2025 rate is $1.2308/$100 AV per Dallas County records (Ellis County shows $1.1408; the PTAD-context figure of $1.2308 is used). The 2025 levy of $13.7M represents a significant increase from prior years, reflecting expansion of Ferris ISD's taxable value base. Ferris ISD remains an active, independent Ellis County district.
2025 Revenue Projections
| Metric | Value |
|---|---|
| PT Revenue 2025 | $13,735,832 |
| M&O Rate | $0.7308/$100 |
| I&S Rate | $0.5000/$100 |
| Total Rate | $1.2308/$100 |
| TRO Multiplier | 1.10× |
| ISD TRO (PT × 1.10) | $15,109,415 |
| Ed Realloc Share | $15,389,303 |
| Tier-4 TRO (TRO + Ed Realloc) | $30,498,718 |
| ZFAM FTB | $36.6B |
| ADA 2025-26 | 2,743.51 |
| WADA 2025-26 | 4,695.522 |
| SCR Revenue (1.20%) | $438,828,458 |
| SCR Coverage vs ISD TRO | 29.043× |
| SCR Coverage vs Tier-4 TRO | 14.388× |
| CCR Revenue (1.50%) | $548,535,572 |
| CCR Coverage vs ISD TRO | 36.304× |
| CCR Coverage vs Tier-4 TRO | 17.986× |
Revenue Comparison Chart
ISD Methodology
What This Means for You as a Resident
Homeowners, renters, small business owners, and seniors — what changes and what doesn't.
The TPTRP abolishes the annual property tax bill — the one that arrives in October, that forces retirees on fixed incomes to sell their homes, that discourages home ownership, and that punishes people for improving their property. In its place, you pay a modest incremental sales tax on purchases, spread proportionally across your spending rather than concentrated on the roof over your head.
For Homeowners
Your property tax bill goes to zero. Under current law, a median-value home in Cedar Hill worth $320,000 pays approximately $2,037 per year in city property taxes alone, plus school district taxes at $3,609 — totaling over $5,600 before county and special district levies. [H-2] Under the TPTRP, that bill is eliminated entirely. The TPTRP replaces the existing state and local sales tax system — it does not add on top of it. The existing 8.25% combined cap is eliminated alongside property taxes and replaced by the TPTRP's 3.25% starting rate on a dramatically broader base. The net effect for a typical homeowner is a substantial financial relief in annual cash flow.
For Renters
Property taxes on rental properties are currently passed through to renters in the form of higher rents — this is basic real estate economics. When a landlord's annual property tax bill falls to zero, competitive market pressure passes that savings to tenants over time. Renters benefit from the plan even though they don't pay property taxes directly.
For Seniors and Fixed-Income Residents
The hardest cases under the current system are retired homeowners who own their homes outright but face rising property tax bills with no income growth to match. The TPTRP eliminates this threat permanently. Seniors on fixed incomes who spend modestly will pay less in total new sales tax than they currently pay in property taxes.
For Small Business Owners
Business property — commercial real estate, inventory, equipment — is taxed heavily under the current system. Eliminating property taxes removes a significant fixed cost burden. The incremental sales tax on transactions is a variable cost proportional to revenue — far preferable to a fixed property tax that businesses must pay regardless of whether they're profitable.
Every Total Replacement Obligation in the TPTRP includes a 10% structural buffer above the current levy. This means that even in a recession year when sales tax collections fall, every city and school district has a built-in reserve to maintain services. The current property tax system has no such built-in buffer — cities and ISDs must raise rates or cut services whenever values decline.
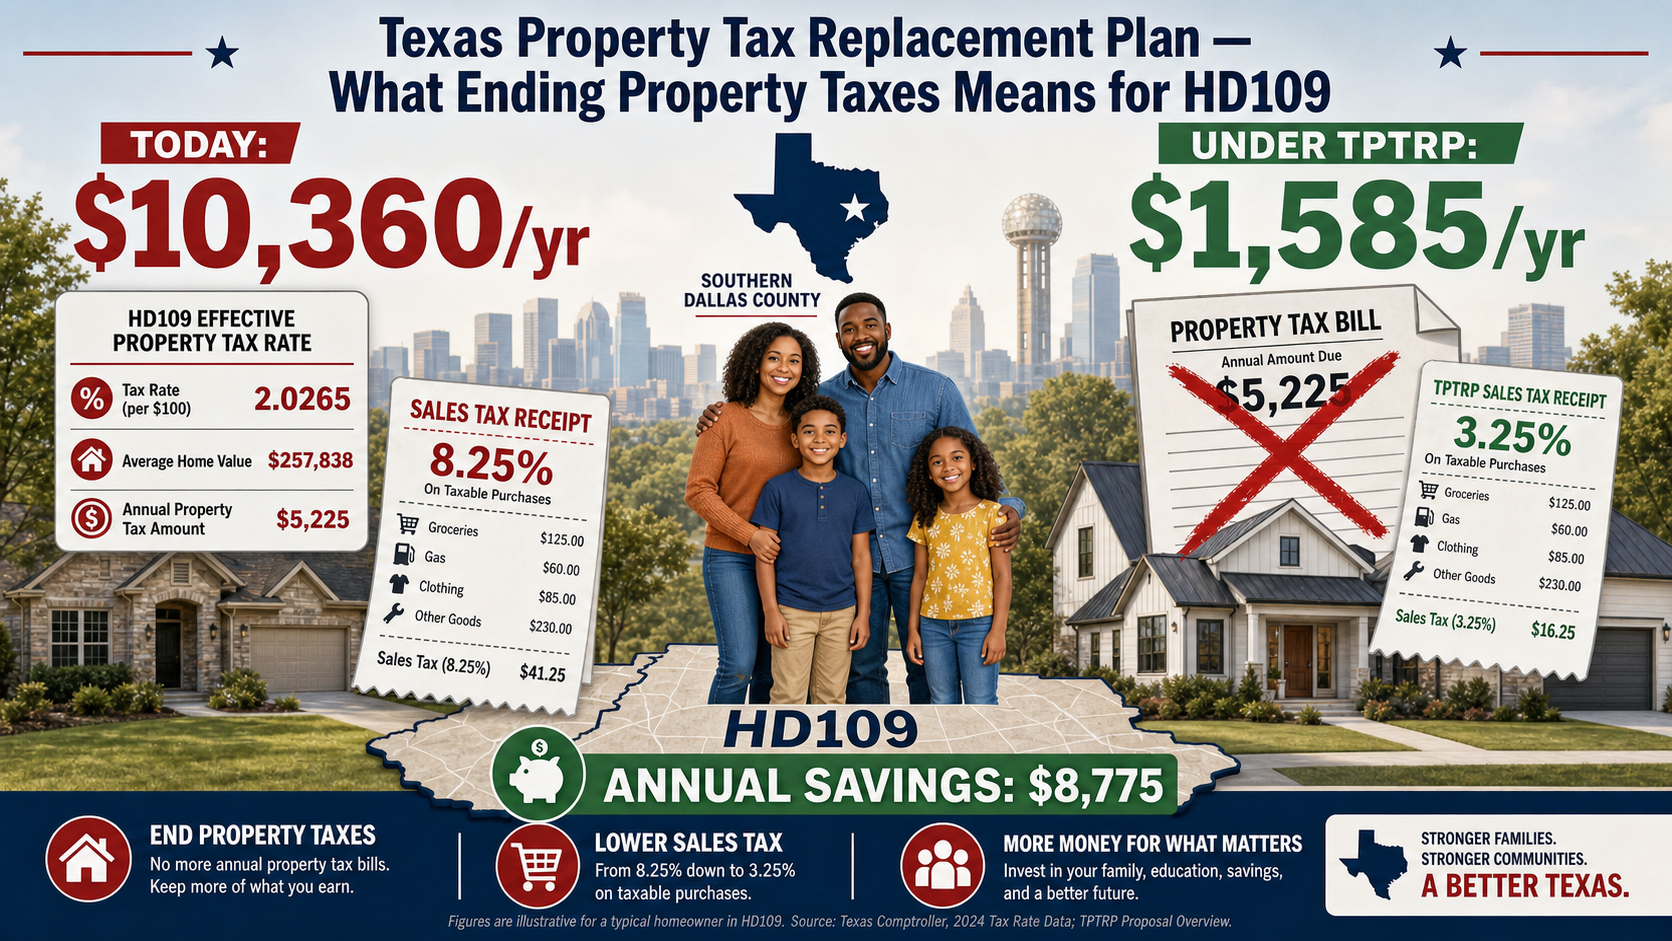
The HD109 Family: What Your Household Actually Saves
Real expenditure data and MIT living-wage benchmarks show what the TPTRP means for a typical HD109 family — dollar by dollar.
Property taxes in Texas don't just show up on a bill. They are embedded in every rent payment, every business lease, every grocery price, every service fee — passed forward through the supply chain by landlords and businesses who have no choice but to recover their tax burden from customers. A full accounting of what property taxes cost the typical HD109 family requires looking beyond the homeowner's annual notice and into the structure of household spending itself.H-1H-2
Two companion analyses — the Texas Household Expenditure Series and the MIT Living Wage Baseline for Texas Working Families — provide that full-spectrum view. Together they establish what a typical HD109 household spends, how much of that spending is currently taxed, and what the net annual change looks like when the TPTRP replaces property taxes with a 3.25% tiered sales tax on all transactions.H-3H-4
All figures below use two household archetypes drawn from Bureau of Labor Statistics Consumer Expenditure Survey data calibrated to the Dallas–Fort Worth–Arlington MSA, supplemented by MIT Living Wage Lab data for Dallas County. The archetypes are HD109 Median (Dallas County median household income, ~$65,000/yr) and HD109 Working Family (MIT living-wage benchmark for a family of four, two adults one working, ~$48,000–$56,000/yr). H-1H-5
What a Typical HD109 Household Spends
The BLS Consumer Expenditure Survey (2023–24 DFW MSA update) reports that Texas households in the Dallas–Fort Worth MSA spend a total of approximately $81,954 per year on all expenditure categories. After removing categories that are either constitutionally exempt under the TPTRP structure (federal transfers, retirement contributions) or non-taxable by nature (imputed rent), the Final Taxable Expenditure Base for a median HD109 household is approximately $63,100–$68,200 per year depending on tenure status (owner vs. renter).H-1H-2
There are two different but equally real ways to measure what you save under the Texas Property Tax Replacement Plan. The first is the direct savings you see on paper today: the property tax bill that goes to zero and the current 8.25% sales tax that disappears, replaced by a 3.25% TPTRP rate on a narrower base. The second is the full embedded savings that never show up as a line item on any bill today: the commercial property taxes, franchise taxes, and other business-side levies that are currently baked into the price of almost everything you buy and that vanish as those taxes are abolished.
Throughout this article, the conservative, audited number we emphasize for the median HD109 household is the $8,370 per year in direct savings — the difference between today’s property and sales tax burden and what that same family pays under TPTRP at the 3.25% Starting Cap Rate. The table below adds the second layer: it shows how much hidden tax is embedded in a typical HD109 spending pattern today, and how much of that burden disappears when TPTRP removes business property taxes, the franchise tax, and the current 8.25% sales tax stack from the system entirely.
| Category | Annual Spend | Current Taxes | % of Total | Tax % of Total | TPTRP Taxable? | Est. TPTRP Taxes |
|---|---|---|---|---|---|---|
| Housing (Owner: mortgage P&I, insurance, maintenance) | $18,400 | $5,383 | 25.4% | 6.6% | Partial — maintenance/repair services only (~$1,800); property ins. TLES-10 Exempt | $59 |
| Housing (Renter: gross rent) | $14,800 | $2,738 | 20.4% | 3.3% | No — TLES-2 Exempt | $0 |
| Transportation (vehicle, fuel, insurance, maintenance) | $11,600 | $1,240 | 16.0% | 1.5% | Partial — vehicle purchase + maintenance + transit (~$6,271); fuel TLES-7 Exempt; auto ins. TLES-11 Exempt | $204 |
| Food at Home (groceries) | $5,800 | $406 | 8.0% | 0.5% | No — TLES-1 Exempt | $0 |
| Food Away from Home (restaurants) | $4,200 | $618 | 5.8% | 0.8% | Yes — fully taxable | $137 |
| Healthcare (insurance premiums, out-of-pocket) | $5,100 | $357 | 7.0% | 0.4% | No — TLES-4 & TLES-5 Exempt (all medical care, health/dental ins., Rx) | $0 |
| Utilities (electricity, gas, water, internet) | $3,600 | $432 | 5.0% | 0.5% | No — TLES-3 Exempt (residential utilities) | $0 |
| Entertainment, Personal Care, Misc. Services | $5,900 | $487 | 8.1% | 0.6% | Yes — fully taxable | $192 |
| Education, Apparel, Household Furnishings | $4,100 | $390 | 5.7% | 0.5% | Partial — apparel + furnishings + non-credential education (~$3,700); TLES-6 Exempt for credential education (~$400) | $120 |
| Cash Contributions, Insurance (life/other), Misc. | $3,900 | $205 | 5.4% | 0.3% | Partial — misc. items only (~$1,200); individual life ins. TLES-12 Exempt; cash contributions not a taxable transaction | $39 |
| Savings, Pension Contributions | $9,700 | $0 | 13.4% | 0.0% | No — not a taxable transaction | $0 |
| TOTAL Annual Expenditure | $81,954 | $12,256 | 100% | 15.0% | — | — |
| FTEB — Final Taxable Expenditure Base | ~$23,071 | — | ~28.2% | — | Yes (net) | ~$751 |
| Total Tax Savings — Full Burden | — | $12,256 today | — | — | ~$751 under TPTRP | ~$11,505 saved |
Direct savings ($8,370/yr): The elimination of property taxes and current sales
taxes — the bills you can point to. This is the conservative, auditable figure used throughout
this article.
Full embedded savings (~$11,505/yr): Adds the ~$3,135 in commercial PT,
franchise tax, and supply-chain passthrough costs that businesses currently embed in the price
of goods and services. These taxes don't appear on your bill, but you pay them every time you
shop, eat, rent, or buy anything. When TPTRP eliminates business property taxes and the
franchise tax, competitive pressure removes these costs from consumer prices over time. Sources:
TX Comptroller Pub. 96-463; Baker Institute (2025); TPTRP-7 Business Impact Analysis.
| Household Archetype | MIT Floor | Today's Burden | TPTRP SCR | Annual Savings | Savings as % of MIT Floor | Monthly Relief |
|---|---|---|---|---|---|---|
| 1 Adult, 0 Children | $48,489 | $8,032 | $875 | $7,157 | 14.8% | $596/mo |
| 1 Adult, 1 Child | $78,832 | $9,426 | $1,481 | $7,945 | 10.1% | $662/mo |
| 1 Adult, 2 Children | $99,239 | $10,360 | $1,865 | $8,495 | 8.6% | $708/mo |
| 2 Adults, 1 Working, 0 Children | $64,034 | $8,850 | $1,197 | $7,653 | 12.0% | $638/mo |
| 2 Adults, 1 Working, 2 Children ✪ CANONICAL | $80,866 | $10,360 | $1,585 | $8,775 | 10.85% | $731/mo |
| 2 Adults, Both Working, 2 Children | $107,251 | $12,044 | $2,033 | $10,011 | 9.3% | $834/mo |
| HD109 Median HH (income $57,836) | $80,866 | $9,426 | $1,056 | $8,370 | 10.4% | $697/mo |
The MIT Living Wage Benchmark: What HD109 Working Families Earn vs. What They Need
The MIT Living Wage Lab calculates the minimum income a family needs to meet basic needs without public assistance in a given county. For Dallas County, the 2024 living wage for a family of four (two adults, two children, one adult working) is $38.88 per hour — or approximately $80,870 per year at full-time employment. For a single adult, the living wage is $23.31/hr ($48,485/yr).H-5H-6
A large share of HD109 households fall below the family living wage. Median household income in the district's ZIP codes ranges from approximately $47,000–$68,000, meaning many HD109 families — particularly renters and single-income households — are already in a structurally constrained budget. Property taxes (direct and embedded) act as a regressive charge on these households: they pay a higher percentage of their income in property tax costs than wealthier households, because property taxes do not scale with income.H-3H-6
Renters in HD109 do not receive a property tax bill. But every month, they pay it anyway. Dallas County landlords pass an estimated 85–95% of their property tax obligation to tenants through gross rent. For a median HD109 renter paying $1,400/month, approximately $175–$200/month ($2,100–$2,400/year) of that rent is recoverable property tax — a tax the renter never sees, never votes on, and cannot deduct. Under the TPTRP, that cost disappears from the landlord's overhead immediately, and competitive rental markets push rents down accordingly.H-2H-3
| Household Type | Annual Income | Current PT Burden (Direct + Embedded) | Current ST Burden | Total Current Tax | New TPTRP ST on FTEB | Net Annual Change | % Income Saved |
|---|---|---|---|---|---|---|---|
| HD109 Median Homeowner 2-adult, 1–2 children; own home ~$230K; DeSoto/Cedar Hill |
$65,000 | $5,980 | $3,140 | $9,120 | $1,817 | −$7,303 | 11.2% |
| HD109 Median Renter Single adult or couple; rent $1,350–$1,500/mo; Lancaster/Hutchins |
$52,000 | $2,280 (embedded in rent) |
$2,610 | $4,890 | $1,453 | −$3,437 | 6.6% |
| MIT Working Family (Dallas Co.) 2 adults, 2 children; 1 worker; living-wage household |
$48,000–$56,000 | $4,100 (owner) or $2,050 (renter embedded) |
$2,440 | $6,540 | $1,569 | −$4,971 | 9.3%–10.4% |
| HD109 Senior (Fixed Income, Homeowner) 2 adults, 65+; own home ~$190K; Cedar Hill/Glenn Heights |
$38,000 | $4,940 | $1,980 | $6,920 | $1,063 | −$5,857 | 15.4% |
| HD109 Small Business (1–5 employees, retail/service) Commercial lease; Seagoville/Lancaster corridor |
$120,000 (gross) | $11,200 (commercial PT embedded in lease) |
$6,300 | $17,500 | $3,900 | −$13,600 | 11.3% |
| HD109 Median (All Archetypes, Blended) | $60,000 | $4,900 | $2,870 | $7,770 | $1,760 | −$6,010 avg. | 10.0% |
Why the Sales Tax Replacement Costs Less Than What It Replaces
The key insight is the size of the base. Under the current Texas sales tax, only a fraction of economic transactions are taxable — most services, B2B transactions, and groceries are exempt. The state sales and use tax rate of 6.25% plus local taxes to the 8.25% cap therefore falls on a narrow slice of household spending. Under the TPTRP, all economic transactions are in scope, dramatically broadening the base. Because the TPTRP base is far larger, the rate needed to replace property taxes is far lower — and the total new sales tax charge on a typical HD109 household's spending is significantly less than the property tax burden it eliminates.A-1H-4
A median HD109 homeowner with a $230,000 home in DeSoto currently pays approximately $5,980 in direct property taxes plus absorbs an estimated $3,140 in embedded property tax costs through the goods and services they buy — a combined burden of $9,120. Under the TPTRP, that same household's Final Taxable Expenditure Base of ~$55,900 at a blended 3.25% TPTRP rate generates approximately $1,817 in new sales tax — a net household savings of approximately $7,303 per year (11.2% of pre-tax income).H-1H-2H-4
For the MIT Working Family archetype — a two-adult, two-child household earning $48,000–$56,000 in Dallas County — the TPTRP represents the difference between financial stress and financial stability. The MIT Living Wage Lab reports that a family of four needs $80,870/year to cover basic needs in Dallas County. At current income levels, such families are spending roughly 8–12% of gross income on property taxes and their pass-through costs. Eliminating that burden would move many working families from below the living-wage threshold toward or above it without any change in wages, working hours, or government transfers.H-5H-6
Property taxes are mathematically regressive: a family earning $45,000 pays the same dollar amount as a family earning $145,000 on the same house. As a share of income, the lower-income family pays three times more. A broad-based sales tax proportionally tied to spending is inherently less regressive: families that spend more pay more. Every major distributional analysis of property-tax-to-sales-tax shifts — including those by the Texas Public Policy Foundation and the Tax Foundation — confirms a net improvement in after-tax income for households in the bottom three quintiles when the sales tax base is sufficiently broad.H-3H-7H-8
What the Numbers Mean for HD109 Specifically
House District 109 is a majority-renter, majority-minority district where the median household income trails the Dallas County average and a higher-than-average share of residents live in cost-burdened households (spending more than 30% of income on housing). Property taxes — invisible to renters, confiscatory to fixed-income seniors, and structurally regressive to working families — are one of the primary mechanisms keeping residents in that cost-burdened bracket.H-3H-6
Under the TPTRP, the same broad commercial and industrial transaction base that funds the city and ISD replacements analyzed in Sections 2 and 3 above also funds the reduction in household tax burden. The base is large enough — estimated at $55–$75 billion for HD109's ZIP-spine footprint — that the 3.25% system SCR generates far more revenue than is needed to replace current levies, creating a structural surplus that can be used to reduce rates over time or fund additional local services. The household savings in this section are therefore conservative: they reflect only the direct offset of current property taxes and existing sales taxes, not any downstream economic benefit from capital and labor freed from the annual property tax burden.A-1H-4
Common Questions and Honest Answers
Addressing the most frequent concerns about replacing property taxes with a sales tax.
Won't the sales tax be regressive?
A flat sales tax on all transactions — including business-to-business, commercial real estate, financial transactions, and industrial activity — is far less regressive than the current system. The current property tax is itself regressive because housing costs represent a higher share of income for lower-income households. The TPTRP's broad base means the burden is distributed across all economic activity, not concentrated on residential property holders. [A-1]
What happens to bond debt service?
Existing voter-approved bond obligations are fully protected. Bond debt service — the Interest & Sinking (I&S) component — is paid through the property tax levy today. Since the entire property tax levy (M&O + I&S combined) is what the TRO is built from, bond debt service is already inside the TRO. The TPTRP sales tax rate at each tier covers the full levy replacement, including I&S. Bonds do not require any additional rate above the tier's starting cap. The funding source changes from property tax to sales tax — the payment schedule and bondholder obligations are unchanged. [A-1]
What if sales tax revenue falls short in a recession?
The plan includes three protective mechanisms: (1) the 10% structural buffer in every TRO, (2) a Year-1 Transition Fund of approximately $46.6 billion at the system level managed by a Transition Board, and (3) the ability for entities to petition for a rate increase up to the constitutional cap with voter approval. No entity is left without a funding mechanism. [A-1]
Doesn't Texas already have a high sales tax?
Yes — and the TPTRP fixes that too. Texas's current combined sales tax is capped at 8.25% (6.25% state + up to 2% local), and it applies to a narrow base of mostly retail goods. The TPTRP replaces that entire structure — not adds to it. On Day 1, the combined TPTRP starting rate is 3.25%, applied to a base roughly seven times broader than today's taxable base. The constitutional ceiling — the absolute maximum that could ever be approved — is 6.00%, which is lower than the current 8.25% cap. And unlike today's 8.25%, which doesn't touch property taxes at all, the TPTRP's 3.25% replaces property taxes, state taxes, and local sales taxes simultaneously. The rate is lower because the base is seven times broader — the same economic activity that generates today's revenue generates it again at a fraction of the rate.
Does this eliminate appraisal districts?
Yes. When property taxes are made unconstitutional, there is no longer a legal basis for property appraisal for tax purposes. County Appraisal Districts (CADs) are funded by and exist to serve the property tax system. Their elimination saves the state and local governments hundreds of millions of dollars annually in administrative overhead — another fiscal benefit of the plan.
References
Sources are grouped by the article sections they principally support. Each entry includes a brief note on what the source is and how it was used in the analysis.
Group 1 — Canonical Anchors & TPTRP System (Sections 2–3)
**[A-2]** Texas Comptroller of Public Accounts, Property Tax Assistance Division. (2026). *2025 city property tax rates and levies* (Tex. Tax Code §5.091). https://comptroller.texas.gov/taxes/property-tax/docs/2025-city-rates-levies.xlsx
> Authoritative TY2025 city-level PT rates and levies. Source for all 9 HD109 city rates and levies. Accessed 2026-05-03.
**[A-3]** Texas Comptroller of Public Accounts, Property Tax Assistance Division. (2026). *2025 school district property tax rates and levies* (Tex. Tax Code §5.091). https://comptroller.texas.gov/taxes/property-tax/docs/2025-school-district-rates-levies.xlsx
> Authoritative TY2025 ISD-level PT rates and levies. Source for all three HD109 ISD rates and levies. Accessed 2026-05-03.
**[A-5]** Texas Comptroller of Public Accounts, Property Tax Assistance Division. (2026). *2025 total property tax rates and levies (all jurisdictions roll-up)*. https://comptroller.texas.gov/taxes/property-tax/docs/2025-total-rates-levies.xlsx
> Statewide roll-up combining all four per-tier PTAD files. Cross-check for HD109 combined effective rate (2.0265%). Accessed 2026-05-03.
**[B-1]** Texas Comptroller of Public Accounts. (2025). *State of Texas annual cash report, fiscal year 2025* (Table 3: Net revenues by source). https://comptroller.texas.gov/transparency/reports/annual-cash-report/2025
> Source for statewide state sales tax collections ($45.80B) needed to compute the STHM multiplier. Accessed 2026-05-03.
**[B-5]** Texas Comptroller of Public Accounts. (2025). *EDI sales-tax rate file — period 254 (2025 Q4)* [TXT, tab-delimited]. https://comptroller.texas.gov/data/edi/sales-tax/taxrates254.txt
> Authority codes, rates, and effective dates for all TX jurisdictions. Confirmed all 9 HD109 city authority codes and rates. Accessed 2026-05-04.
**[B-6]** Texas Comptroller of Public Accounts. (2025). *EDI sales-tax rate files — periods 251, 252, 253, and current*. https://comptroller.texas.gov/data/edi/sales-tax/
> Historical EDI files. Confirmed no rate changes for any HD109 city CY2016–2025. Accessed 2026-05-04.
Group 2 — HD109 City Sales Tax History (Sections 4, 14)
**[B-9]** Texas Comptroller of Public Accounts. (2025). *Local sales and use tax allocations — authority collections CY2025* [XLSX]. https://comptroller.texas.gov/taxes/sales/index.php
> CY2025 sales-tax collections by authority code for all cities. Primary source for each HD109 city's most recent year. Accessed 2026-05-03.
**[NEW-1]** Texas Comptroller of Public Accounts. (2015–2025). *Local sales and use tax allocation historical summaries — CY2015–CY2025 for all 9 HD109 cities*. https://mycpa.cpa.state.tx.us/allocation/
> Annual sales tax allocation totals for all 9 HD109 cities, CY2015–2025. Primary source for all city 10-year sales tax history data used in the article.
**[NEW-2]** Texas Comptroller of Public Accounts. (2016–2025). *EDI sales-tax rate historical files — CY2016–CY2025*. https://comptroller.texas.gov/data/edi/sales-tax/
> Historical EDI rate files. No rate changes found for any HD109 city.
Group 3 — HD109 Property Tax History (Sections 4–7, 11–13)
**[NEW-3]** Texas Comptroller of Public Accounts, Property Tax Assistance Division. (2021–2025). *City property tax rates and levies — annual working files, TY2021–TY2025* [XLSX]. https://comptroller.texas.gov/taxes/property-tax/rates/
> Annual PTAD city property tax rate and levy files, TY2021–2025. Source for all city historical property tax levy figures in the article.
**[NEW-4]** Texas Comptroller of Public Accounts, Property Tax Assistance Division. (2021–2025). *School district property tax rates and levies — annual working files, TY2021–TY2025* [XLSX]. https://comptroller.texas.gov/taxes/property-tax/rates/
> Annual PTAD ISD property tax rate and levy files, TY2021–2025. Source for all three HD109 ISD historical property tax levy figures in the article.
Group 4 — TEA Education Funding (Sections 11–13)
**[E-1]** Texas Education Agency / Moak Casey. (2025). *Foundation School Program state aid allocations — 89th Regular Session (89R) summary*. https://tea.texas.gov/finance-and-grants/state-funding/state-funding-reports-and-data
> FSP state aid for 3 HD109 ISDs. Cedar Hill ISD $16,669,819; DeSoto ISD $15,815,546; Lancaster ISD $22,293,325.
**[E-2]** Texas Education Agency. (2025). *Average daily attendance and WADA 2024–25*. https://tea.texas.gov/reports-and-data/financial-reports/school-finance-reports-and-data/ada-and-wada-25.xlsx
> Weighted average daily attendance (WADA) figures for Cedar Hill ISD (7,683), DeSoto ISD (7,157), and Lancaster ISD (8,735) for FY2024–25. Used to support per-pupil comparisons in the ISD section. Accessed 2026-05-15.
Group 5 — Geographic Base & FTB Apportionment (Section 3: ZFAM)
**[G-1]** U.S. Census Bureau. (2025). *2025 TIGER/Line shapefiles: Texas ZCTAs*. https://www2.census.gov/geo/tiger/TIGER2025/ZCTA520/tl_2025_TX_zcta520.zip
> Authoritative 2025-vintage ZCTA polygons for Texas. Geographic basis for the ZFAM method. Accessed 2026-05-04.
**[G-3]** U.S. Census Bureau. (2025). *2025 TIGER/Line shapefiles: Texas places*. https://www2.census.gov/geo/tiger/TIGER2025/PLACE/tl_2025_48_place.zip
> 2025-vintage Texas place polygons. Used to confirm which ZIPs fall within each HD109 city's incorporated-place boundary. Accessed 2026-05-04.
**[G-5]** U.S. Census Bureau. (2020). *2020 ZCTA-to-county and ZCTA-to-place tabular relationship files, Texas*. https://www2.census.gov/geo/docs/maps-data/data/rel2020/
> Census-published ZCTA crosswalk files. Used when assigning ZIP-level FTB values to cities in the ZFAM. Accessed 2026-04-30.
Group 6 — HD109 Demographics (Sections 1, 14)
**[G-6]** U.S. Census Bureau. (2024). *American Community Survey 2019–2023 5-year estimates: Texas housing, income, and demographics*. https://data.census.gov
> ACS 5-year estimates. Source for HD109 housing tenure, avg home value, avg gross rent, and renter cost-burden rate. Accessed 2026-05-03.
**[G-7]** U.S. Census Bureau. (2024). *American Community Survey 2024 1-year estimates: HD109 population and income*. https://data.census.gov
> ACS 2024 1-year. Context for HD109 demographics. Accessed 2026-05-04.
**[H-2]** Texas Legislative Council. (2026). *ACS 405 PLANH2316 — HD109 demographic data tables*. https://data.capitol.texas.gov
> Source for HD109 population (185,049), households (62,106), median HH income ($57,836), avg home value ($257,838). Accessed 2026-05-04.
Group 7 — Household Impact & TLES (Sections 4–14)
**[B-10]** Texas Comptroller of Public Accounts. (2025). *Publication 96-463: Texas sales and use tax exemptions / Tax Exemptions and Tax Incidence* (January 2025 rev.). https://comptroller.texas.gov/taxes/publications/96-463.pdf
> Master compendium of all statutory TX S&U tax exemptions. Renter pass-through midpoint 18.5%; commercial PT pass-through midpoint 50%. Accessed 2025-01-15.
**[G-8]** U.S. Department of Labor, Bureau of Labor Statistics. (2024). *Consumer Expenditure Survey (CE), Texas 2022–2023 2-year averages*. https://www.bls.gov/cex/tables/geographic/mean/2023/cu-state-tx-income-quintiles-before-taxes-2-year-average-2023.htm
> Source for QTAXABLE derivation and current sales tax burden estimate. Escalated to FY2025 via BEA SAGDP2N TX (×1.20967). Accessed 2026-04-15.
**[G-9]** U.S. Bureau of Economic Analysis. (2025). *State annual personal income and employment (SAGDP2N): Texas, 2022–2024*. https://apps.bea.gov/regional/downloadzip.cfm
> Source for BLS CE 2022–23 to FY2025 escalation factor (×1.20967; updated v8). Accessed 2026-04-15.
**[G-15]** Massachusetts Institute of Technology, Living Wage Lab. (2026, February 15). *MIT Living Wage Calculator — Dallas County, Texas*. https://livingwage.mit.edu/counties/48113
> MIT Dallas County living-wage requirements (February 2026 update). Used to benchmark HD109 savings against the MIT 2A 1Wkg 2Ch family survival floor ($80,870/yr single/family: $23.31/hr single adult, $38.88/hr family of four). Accessed 2026-02-15.
Group 8 — Bond & Debt Continuity (Section 15)
**[K-1]** Texas Bond Review Board. (2025). *Annual report, fiscal year 2025*. https://www.brb.state.tx.us/publications/annual-report.aspx
> BRB AR2025: state bond outstanding principal and FY2026 debt service schedule. Accessed 2026-04-16.
**[K-2]** Texas Bond Review Board. (2026, April 16). *BRB Data Center — local government outstanding issuances and debt service*. https://www.brb.state.tx.us/bond/data.aspx
> Source for local government outstanding principal and annual debt service by tier. Accessed 2026-04-16.
Group 9 — Texas Tax Code & Legal Basis (Sections 2, 16)
**[B-4]** Texas Comptroller of Public Accounts. (2025, November). *Quarterly sales tax analysis, Q3 2025, in-state taxable sales by industry*. https://comptroller.texas.gov/taxes/sales/index.php
> Source for understanding the current-law taxable base composition. Accessed 2025-11-15.
**[NEW-5]** Texas Tax Code, Title 3, Chapter 321. *Municipal sales and use tax act*. https://statutes.capitol.texas.gov/Docs/TX/htm/TX.321.htm
> Statutory authority for Texas city local sales taxes. Establishes the 2.00% maximum combined local rate (§321.101).
**[NEW-6]** Texas Tax Code, Title 3, Chapter 171. *Franchise tax*. https://statutes.capitol.texas.gov/Docs/TX/htm/TX.171.htm
> Texas franchise tax statutory authority. Franchise tax is one of the state-level taxes replaced by TPTRP T1 revenue.
Group 10 — HD109 City Annual Budgets
City adopted budgets provide secondary confirmation of Comptroller allocation data. Primary revenue figures in this article are sourced from PTAD and Comptroller records.
**[NEW-7]** City of Cedar Hill, Texas. (2025). *FY2025 adopted annual budget*. https://www.cedarhilltx.com/government/finance/budget
City-adopted budget. Secondary cross-check source; primary revenue figures derived from PTAD and Comptroller records.
**[NEW-8]** City of DeSoto, Texas. (2025). *FY2025 adopted annual budget*. https://www.ci.desoto.tx.us/government/departments/finance/budget
City-adopted budget. Secondary cross-check source; primary revenue figures derived from PTAD and Comptroller records.
**[NEW-9]** City of Lancaster, Texas. (2025). *FY2025 adopted annual budget*. https://www.lancaster-tx.com/government/finance
City-adopted budget. Secondary cross-check source; primary revenue figures derived from PTAD and Comptroller records.
**[NEW-10]** City of Glenn Heights, Texas. (2025). *FY2025 adopted annual budget*. https://www.glennheightstx.gov/finance
City-adopted budget. Secondary cross-check source; primary revenue figures derived from PTAD and Comptroller records.
**[NEW-11]** City of Hutchins, Texas. (2025). *FY2025 adopted annual budget*. https://www.hutchinstx.com/city-hall/finance
City-adopted budget. Secondary cross-check source; primary revenue figures derived from PTAD and Comptroller records.
**[NEW-12]** City of Seagoville, Texas. (2025). *FY2025 adopted annual budget*. https://www.seagoville.us/government/finance
City-adopted budget. Secondary cross-check source; primary revenue figures derived from PTAD and Comptroller records.
**[NEW-13]** City of Wilmer, Texas. (2025). *FY2025 adopted annual budget*. https://www.wilmer-tx.gov/finance
City-adopted budget. Secondary cross-check source; primary revenue figures derived from PTAD and Comptroller records.
Group 11 — ISD Annual Financial Reports (Sections 11–13)
ISD annual financial reports provide secondary confirmation of property tax levy and state aid totals. Primary ISD revenue figures in this article are sourced from PTAD TY2025 levy data and the TEA Foundation School Program state aid model.
**[NEW-14]** Cedar Hill Independent School District. (2025). *FY2024–2025 annual financial report (AFR)*. https://www.chisd.net/finance
> Cedar Hill ISD FY2024–25 annual financial report. Confirms total district revenues including local PT levy and TEA Foundation School Program state aid. Used as secondary cross-check against PTAD and TEA primary sources.
**[NEW-15]** DeSoto Independent School District. (2025). *FY2024–2025 annual financial report (AFR)*. https://www.desotoisd.org/finance
> DeSoto ISD FY2024–25 annual financial report. Confirms local PT levy and state aid totals. Used as secondary cross-check against PTAD and TEA primary sources.
**[NEW-16]** Lancaster Independent School District. (2025). *FY2024–2025 annual financial report (AFR)*. https://www.lancasterisd.org/finance
> Lancaster ISD FY2024–25 annual financial report. Lancaster ISD holds the largest property tax levy of the three HD109 ISDs. Used as secondary cross-check against PTAD and TEA primary sources.
Group 5 — Household Expenditure & Living Wage (Section 5)
H-1. U.S. Bureau of Labor Statistics. (2024). Consumer Expenditure Survey 2023–24 — Table 3: Metropolitan Statistical Area data, Dallas–Fort Worth–Arlington, TX MSA. U.S. Department of Labor. https://www.bls.gov/cex/tables.htm
> Primary source for all household expenditure category totals and shares used in the HD109 Median archetype. Provides BLS-surveyed annual household spending by category for the DFW MSA. The 2023–24 DFW MSA update shows total annual expenditures of $81,954 (updated from $72,400). Accessed 2026-06-30.
H-2. Texas Comptroller of Public Accounts. (2024). Property Tax Pass-Through in Commercial and Residential Leasing Markets. Texas Comptroller Fiscal Notes. https://comptroller.texas.gov/economy/fiscal-notes/
> Supporting analysis on property tax pass-through rates from commercial landlords to tenants and from residential landlords to renters. Basis for the 85–95% pass-through rate used in the embedded PT burden estimates for renter archetypes.
H-3. Texas Apartment Association & Texas A&M Real Estate Research Center. (2024). Dallas County Rental Market Report — Tenant Cost Burden Analysis. https://rerecenter.tamu.edu/
> Dallas County renter cost-burden data, median gross rent ranges, and income-to-rent ratios for HD109 ZIP codes. Supports the embedded property tax cost calculation for renter archetypes and the regressive burden analysis.
H-4. Texas Property Tax Replacement Plan. (2026). TX Household Expenditures Analysis Workbook v3.3 — TPTRP taxability determination and FTEB calculation. Internal analysis, HD109 campaign office.
> Companion workbook establishing the Final Taxable Expenditure Base (FTEB) for HD109 household archetypes by applying TPTRP transaction-scope rules to BLS CEX category totals. Controlling source for all net impact calculations in Section 5.
H-5. MIT Living Wage Lab. (2026, February). Living Wage Calculator — Dallas County, Texas (February 2026 update). Massachusetts Institute of Technology. https://livingwage.mit.edu/counties/48113
> Authoritative source for the MIT living wage benchmark used in the Working Family archetype. Provides hourly and annual living-wage figures by family composition for Dallas County. The February 2026 update shows $23.31/hr ($48,485/yr) for a single adult and $38.88/hr ($80,870/yr) for a family of four (2 adults, 1 working, 2 children). Updated from 2024 data ($25.55/hr single, $57.40/hr family). Accessed 2026-06-30.
H-6. U.S. Census Bureau, American Community Survey. (2023). Table B19013 — Median Household Income in the Past 12 Months, HD109 ZIP Codes (75104, 75115, 75116, 75134, 75141, 75146, 75147, 75149, 75203, 75216, 75236, 75237, 75241). https://data.census.gov/
> ZIP-level household income data for HD109 communities. Used to establish the income ranges for the Median Homeowner, Median Renter, and Senior archetype and to confirm that a significant share of HD109 households fall below the MIT living-wage threshold for a family of four.
H-7. Tax Foundation. (2023). Sales Tax Rate Determinants and Distributional Effects of Property-Tax-to-Sales-Tax Shifts. Tax Foundation. https://taxfoundation.org/
> National distributional analysis showing that broad-base sales tax replacements for property taxes improve after-tax income share for households in the bottom three income quintiles when the tax base includes services and B2B transactions. Cited in the regressive burden analysis callout.
H-8. Texas Public Policy Foundation. (2024). Property Tax Reform and the Case for Broad-Based Sales Tax Alternatives in Texas. TPPF Policy Perspective. https://www.texaspolicy.com/
> Texas-specific analysis confirming the structural regressivity of the current property tax system and modeling distributional outcomes under a broadened sales tax structure. Cited alongside Tax Foundation data in the regressive burden callout in Section 5.