
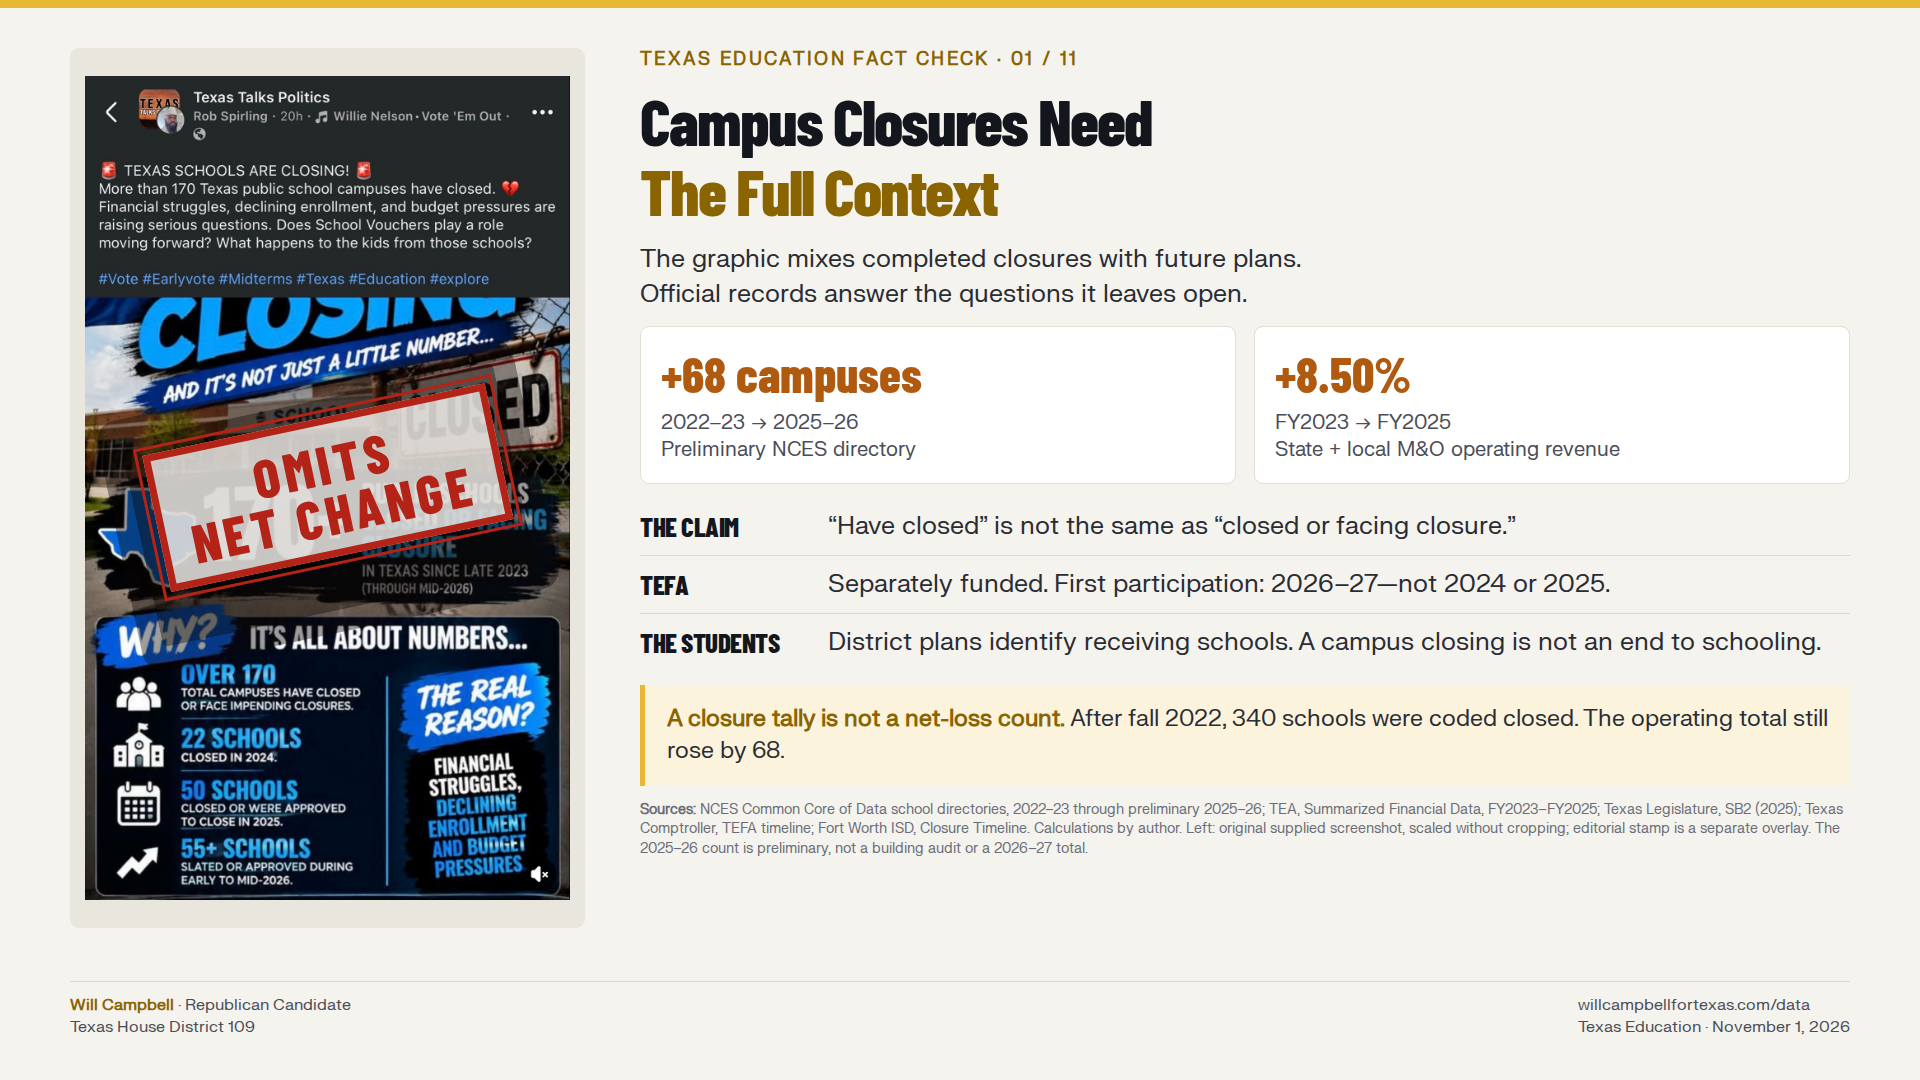
Texas School Campus Closures in Context
What official records show about campus counts, public-school funding, TEFA, future consolidations, and where affected students go.
Key Findings
Campus closures are not district dissolutions or the termination of children's educational placements. Official district plans identify receiving campuses, attendance-boundary changes, mergers, and co-locations. (FWISD, n.d.-a, n.d.-c; RISD, 2024; HISD, 2026) ↗ ↗ ↗ ↗
The National Center for Education Statistics school directory counts 9,180 operating Texas public schools in 2022–23 and 9,248 in the preliminary 2025–26 directory: a net increase of 68, approximately 0.74%. Across the three annual transitions after 2022–23, 340 previously operating schools were coded closed. Those exits were offset by 233 new school identifiers, 167 returns from inactive status, and 242 schools that had been coded future. TEA’s 2025–26 enrollment report separately lists 9,231 campuses. No 2026–27 annual campus census is available. (NCES, 2022, 2023, 2024, 2025, 2026; TEA, 2026a) ↗ ↗ ↗ ↗ ↗ ↗
Combined statewide General Fund state revenue and local M&O property-tax revenue increased 8.50% between FY2023 and FY2025. Federal operating revenue declined, and General Fund expenditures grew faster than operating revenue. (TEA, n.d.-c; calculations) ↗
TEFA has a separate General Revenue account, rather than a mechanism directly transferring districts' operating allotments into participant accounts. Its first participation year is 2026–27, so actual TEFA-funded departures cannot explain closures completed in 2024 or 2025. Enrollment-related formula effects remain a separate question. (Texas Legislature, 2025; LBB, 2025; Texas Comptroller of Public Accounts, n.d.) ↗ ↗ ↗
Fort Worth's official timeline identifies eight future retirements in June 2027–2029 and gives receiving schools for every one. This is a district-specific schedule, not a statewide future-closure total. (FWISD, n.d.-c) ↗
Texas Education Fact Check · 01 / 11
Campus Closures Need The Full Context
Completed closures, future plans and a statewide net change are different questions.
Net Change
2022–23 → 2025–26 preliminary directory
FY2023 → FY2025; state + local M&O revenue
Sources: NCES, 2023; NCES, 2026; TEA, n.d.-c; BLS, n.d.; TEA, n.d.-e; Texas Legislature, 2025; LBB, 2025; Texas Comptroller of Public Accounts, n.d.; FWISD, n.d.-a; FWISD, n.d.-c; RISD, 2024; HISD, 2026. Original supplied screenshot is the claim being examined, not a statistical authority.
What the meme claims
The social-media post describes more than 170 campuses as already closed, while its graphic combines campuses closed with those facing closure. Completed actions, approved future actions, and proposals are materially different categories. The displayed annual minimum figures—22, 50, and 55-plus—also do not provide a complete reconciliation to 170-plus. (Source: original social-media screenshot reproduced in the opening infographic.)
A gross closure tally does not establish the statewide net change in campuses. Openings, replacements, reorganizations, and changes in reporting identities must also be considered.
Texas Education Fact Check · 03 / 11
Completed Closures Are Not Future Plans
The original post changes categories within its own wording.
≠
“Closed or facing closure”
| Displayed year | Figure | Category |
|---|---|---|
| 2024 | 22 | Closed |
| 2025 | 50 | Closed or approved |
| 2026 | 55+ | Slated or approved |
Minimum subtotal of displayed annual figures
Headline is not reconciled in the image
Sources: Original supplied screenshot, IMG_2962.jpeg; arithmetic by author. The image’s statements are being evaluated, not adopted as statewide statistics.
Districts versus campuses
TEA’s final 2024–25 financial-accountability release reports 1,018 traditional school districts, separately from charter systems. The directory classification developed during this analysis identified 1,011 conventional ISDs, with six common school districts and Stafford Municipal School District comprising the other seven traditional districts. (TEA, 2025; TEA, n.d.-a; classification)
Sources: TEA (2025), TEA (2026a), and AskTED.
AskTED’s categories include special-purpose and other entities, so a raw category labeled “independent” should not automatically be described as a count of conventional local ISDs. The meme concerns individual campuses, not 170 dissolved districts. (TEA, n.d.-a)
| Measure | Count | Qualification |
|---|---|---|
| Traditional local school districts | 1,018 | Published TEA financial-accountability count |
| Conventional independent school districts | 1,011 | Calculated directory classification, not a separately published TEA headline |
| Other traditional local districts | 7 | Six common districts and Stafford MSD |
| Campuses in TEA’s published 2025–26 enrollment report | 9,231 | Enrollment-report count; excludes state-administered districts |
| Operating public schools, preliminary 2025–26 | 9,248 | NCES directory; October 1, 2025 snapshot |
Operating public schools, year by year
The campus count is the number of Texas public schools coded Open or New in the NCES Common Core of Data school directory. Those are the schools the directory treats as operating at the start of the school year. Closed, inactive, and future schools are not included in the total. The 2021–22 through 2024–25 totals match NCES’s published Table 3. The 2025–26 file is preliminary version 0a and uses an October 1, 2025 snapshot. (NCES, 2022, 2023, 2024, 2025, 2026) ↗ ↗ ↗ ↗ ↗
From 2022–23 to preliminary 2025–26, the change is 9,180 to 9,248: a net increase of 68, approximately 0.74%. The percentage is 68 divided by 9,180, multiplied by 100. This is the fall 2022 comparison. It is not a count through October 2026.
Charter-labeled operating schools increased from 1,039 to 1,095 over that period, a gain of 56. Schools not labeled charter increased from 8,141 to 8,153, a gain of 12. The 2024–25 statewide decrease was a decline of 36 schools not labeled charter, partly offset by 11 additional charter-labeled schools. A charter label is not the same thing as a traditional school district.
TEA’s Pocket Edition prints 9,054 campuses for 2022–23 and 9,088 for both 2023–24 and 2024–25. Those published figures are not treated as incomplete, and they are not used as this operating-school census. TEA’s enrollment reports say “more than 9,100” campuses in 2022–23 and “nearly 9,200” in 2024–25. The 2025–26 enrollment report gives an exact count of 9,231 campuses, excluding state-administered districts, and reports 5,467,642 enrolled students. That campus count is 17 below the preliminary directory total. The reports do not identify those 17 schools. The 2026 accountability highlights separately count 9,105 campuses in the rated universe. School-year results for 2026–27 are outside this comparison. (TEA, 2024, 2026d, 2026a, 2026e) ↗ ↗ ↗ ↗
Explore the graphic and supporting data using the tabs at the end of this section. Each table can be downloaded as CSV.
Texas Education Fact Check · 02 / 11
Campus Closures Are Not A Statewide Net-Loss Count
The bars are status changes after 2022–23. They are not the annual operating totals.
2022–23 to preliminary 2025–26
Net increase in operating schools
Sources: NCES, 2023; NCES, 2024; NCES, 2025; NCES, 2026. Author calculations from Texas directory records. The chart shows the three-year status changes, not the annual operating totals. 2025–26 is preliminary.
| School year | Operating public schools | Change | Release |
|---|---|---|---|
| 2021–22 | 9,105 | — | Provisional version 1a |
| 2022–23 | 9,180 | +75 | Provisional version 1a |
| 2023–24 | 9,217 | +37 | Final version 1a |
| 2024–25 | 9,192 | −25 | Final version 1a |
| 2025–26, preliminary | 9,248 | +56 | Preliminary version 0a |
Closures, openings, and net change
A gross closure tally is not a statewide net-change calculation. A school is counted as closed only when it was operating and the next directory codes it Closed. Inactive and future-status moves are kept separate, because folding them into closures or openings would make the arithmetic miss the change in the operating total. (NCES, 2022, 2023, 2024, 2025, 2026) ↗ ↗ ↗ ↗ ↗
| Transition | Coded closed | Moved to inactive | New school IDs | Returned from inactive | Future schools that opened | Net change |
|---|---|---|---|---|---|---|
| 2022–23 to 2023–24 | 111 | 58 | 69 | 67 | 70 | +37 |
| 2023–24 to 2024–25 | 124 | 96 | 79 | 49 | 67 | −25 |
| 2024–25 to 2025–26 | 105 | 80 | 85 | 51 | 105 | +56 |
| Three-year total | 340 | 234 | 233 | 167 | 242 | +68 |
After fall 2022, the directories coded 340 previously operating schools closed and added 233 new school identifiers. Those two figures do not by themselves explain the net change. Another 234 operating schools became inactive, while 167 inactive schools returned and 242 previously future schools began operating. The operating total still rose by 68.
School organizations and physical buildings are different units. Houston distinguishes closures, mergers, and co-locations. Fort Worth's future timeline identifies two middle-school retirements with transfers to newly constructed receiving schools. Consequently, a campus retirement does not necessarily mean a school building was removed from service without replacement. (HISD, 2026; FWISD, n.d.-c) ↗ ↗
These are directory status changes, not a building-by-building audit. Closed records remain on the file for only one year, so the annual closed counts are more complete than a first-to-last file comparison. Statewide totals include charter-labeled schools. A statewide increase can coexist with closures in individual traditional districts. (NCES, 2022, 2023, 2024, 2025, 2026) ↗ ↗ ↗ ↗ ↗
Gross closures and the statewide total
The supplied post describes more than 170 campuses as already closed, while its graphic also includes campuses facing closure. The directory count does not identify those specific campuses, so it neither confirms nor disproves 170 as a tally of particular closures. What it does show is that a gross closure claim is not a statewide net loss. After 2022–23, 340 previously operating schools were coded closed, and the operating total still rose by 68 because new, returning, and formerly future schools offset those exits. This report does not divide 170 by the campus total and call the result a closure rate. (NCES, 2022, 2023, 2024, 2025, 2026) ↗ ↗ ↗ ↗ ↗
Officially scheduled future consolidations
Fort Worth ISD's official Boundary Maps page publishes the following future campus-retirement schedule. Its overview identifies the consolidation plan as Board-approved. Dates and receiving schools below follow the district timeline; they are plans, not completed historical closures. (FWISD, n.d.-a, n.d.-c) ↗ ↗
Source: FWISD (n.d.-c), Closure Timeline. Eight retirements are identified: three in 2027, three in 2028, and two in 2029.
These eight entries are a Fort Worth schedule, not a statewide total. They must not be subtracted from historical counts as though already completed. A future statewide net projection would also require scheduled openings, replacements, and other changes.
Fort Worth's broader overview describes 18 retirements beginning in June 2025 and extending through June 2029. That multiyear overview is not a count of closures still pending after October 2026. (FWISD, n.d.-a) ↗
Explore the graphic and supporting data using the tabs at the end of this section. Each table can be downloaded as CSV.
Texas Education Fact Check · 11 / 11
Eight Future Retirements. Eight Receiving Plans.
Fort Worth ISD’s published schedule—not a statewide pending total.
Atwood McDonald → Bill J. Elliott; East Handley
J. T. Stevens → Westcreek; Bruce Shulkey
Sunrise-McMillan → Leadership Academy at Maude I. Logan; Maudrie Walton; W. M. Green
H. V. Helbing → Diamond Hill; M. H. Moore
Morningside Middle → new William James Middle
Sources: FWISD, n.d.-c
| Scheduled retirement | Campus | Receiving schools |
|---|---|---|
| June 2027 | A. M. Pate Elementary | C. C. Moss |
| June 2027 | Atwood McDonald Elementary | Bill J. Elliott; East Handley |
| June 2027 | J. T. Stevens Elementary | Westcreek; Bruce Shulkey |
| June 2028 | Harlean Beal Elementary | David K. Sellars |
| June 2028 | Sunrise-McMillan Elementary | Leadership Academy at Maude I. Logan; Maudrie Walton; W. M. Green |
| June 2028 | H. V. Helbing Elementary | Diamond Hill; M. H. Moore |
| June 2029 | Kirkpatrick Middle | Newly constructed J. P. Elder Middle |
| June 2029 | Morningside Middle | Newly constructed William James Middle |
Funding over the period
The financial comparison uses FY2023 as the baseline, FY2024 and FY2025 actuals, and separately labeled FY2026 adopted budgets. The principal measure is General Fund state operating revenue plus local M&O property-tax revenue, excluding recapture as specified in TEA’s fields. Debt-service property taxes are not added to this operating measure. (TEA, n.d.-c; TEA, n.d.-d)
Amounts are billions of nominal dollars.
Source: calculations from TEA summarized financial actuals. Displayed amounts are rounded.
Combined state-and-local operating revenue increased. It would be inaccurate to claim that state revenue and property-tax revenue each increased throughout the period.
State appropriations also include money replacing local revenue through property-tax relief. An increase in state appropriations therefore cannot automatically be described as an equal increase in additional district purchasing power. (LBB, 2024)
Inflation and enrollment
Using the funding analysis’s September–August CPI-U adjustment, combined state-and-local revenue increased approximately 2.43% in real total dollars and 1.96% in real dollars per enrolled student between FY2023 and FY2025. Real total General Fund operating revenue per student was approximately unchanged. (TEA, n.d.-c; U.S. Bureau of Labor Statistics [BLS], n.d.; calculations)
CPI-U is a general inflation measure, not a school-specific cost index. It does not independently establish changes in each district’s compensation, insurance, utilities, transportation, or facility costs.
Statewide enrollment also did not decline continuously: TEA’s published series rises from 5,518,432 in 2022–23 to 5,544,255 in 2024–25, then falls to 5,467,642 in 2025–26. Individual districts can experience sustained declines while the statewide population follows a different pattern. (TEA, 2026a)
Other financial pressures
All Funds federal operating revenue fell from approximately $14.133 billion in FY2023 to $8.131 billion in FY2025, a decline of 42.47%. All Funds total operating revenue declined approximately 0.76% in nominal terms. (TEA, n.d.-c; calculations)
General Fund operating expenditures grew faster than operating revenue. The difference between those measures is not the total change in fund balance, because financing, transfers, other receipts, and other transactions fall outside that subtraction. (TEA, n.d.-c)
The evidence supports rising state-and-local funding alongside continuing financial pressures—not either a universal funding collapse or the disappearance of all financial constraints.
FY2026 adopted budgets
FY2026 adopted budgets show higher expected statewide state-and-local General Fund revenue than FY2025 actuals. These comparisons are budget-to-actual, not final FY2026 collections. (TEA, n.d.-e)
Sources: TEA actual financial data and FY2026 adopted budgets; calculations.
Statewide enrollment and purchasing power
Source: TEA (2026a). District enrollment trends can differ from the statewide pattern. Per-student financial calculations use enrollment from the same financial dataset.
Sources: TEA (n.d.-c); BLS (n.d.); calculations.
General Fund operating revenue less operating expenditure moved from approximately positive $1.245 billion in FY2023 to negative $1.995 billion in FY2025. This is not the full change in fund balance. (TEA, n.d.-c; calculations) ↗
TEA identifies $8.5 billion in additional public-education funding over the 2026–27 biennium under HB2. This amount must not be added again to budgets already incorporating anticipated funding. (TEA, n.d.-g) ↗
Explore the graphic and supporting data using the tabs at the end of this section. Each table can be downloaded as CSV.
Texas Education Fact Check · 04 / 11
State + Local Funding Increased, Not Decreased
General Fund state operating revenue + local M&O property-tax revenue; actuals, nominal dollars.
Increase over FY2023–FY2025
Combined nominal growth
| Component | FY2023–25 |
|---|---|
| State operating revenue | +29.00% |
| Local M&O property-tax revenue | −8.01% |
Sources: TEA, n.d.-c; BLS, n.d.; TEA, n.d.-e; LBB, 2024. Author calculations. Same values as the Statewide Actuals table tab; bars begin at zero.
| Statewide measure | FY2023 | FY2024 | FY2025 | FY2023–25 change |
|---|---|---|---|---|
| General Fund state operating revenue | $23.095 | $29.413 | $29.792 | +29.00% |
| General Fund local M&O property-tax revenue | $28.690 | $25.114 | $26.392 | −8.01% |
| Combined state-and-local measure | $51.785 | $54.528 | $56.184 | +8.50% |
| Total General Fund operating revenue | $56.456 | $59.023 | $60.079 | +6.42% |
| General Fund operating expenditures | $55.211 | $59.335 | $62.074 | +12.43% |
Texas Education Fact Check · 06 / 11
Higher State + Local Aid Did Not Erase Pressures
Separate revenue streams, inflation and operating costs.
$14.133B → $8.131B · FY2023–FY2025
General Fund operating revenue growth
General Fund operating expenditure growth
Sources: TEA, n.d.-c; BLS, n.d.; TEA, n.d.-e. Author calculations. CPI-U September–August averages; General Fund and All Funds are different measures.
| Measure | FY2025 actual | FY2026 budget | Change |
|---|---|---|---|
| General Fund state revenue | $29.792 billion | $32.932 billion | +10.54% |
| Local M&O property-tax revenue | $26.392 billion | $26.926 billion | +2.02% |
| Combined state-and-local revenue | $56.184 billion | $59.859 billion | +6.54% |
| Total General Fund operating revenue | $60.079 billion | $63.017 billion | +4.89% |
| School year | Published statewide enrollment |
|---|---|
| 2022–23 | 5,518,432 |
| 2023–24 | 5,531,236 |
| 2024–25 | 5,544,255 |
| 2025–26 | 5,467,642 |
| Statewide financial measure | FY2023–25 change |
|---|---|
| State-and-local revenue, nominal total | +8.50% |
| State-and-local revenue, real total | +2.43% |
| State-and-local revenue per student, nominal | +7.99% |
| State-and-local revenue per student, real | +1.96% |
| Total General Fund operating revenue per student, real | Approximately unchanged |
Closing districts’ funding
The case-study comparison covers eight districts with documented closures or consolidations. It is not a statistically representative sample of every closing district.
Revenue amounts are millions of nominal dollars.
Source: district-matching calculations using TEA summarized financial actuals.
Combined enrollment fell 3.65%, while the specified state-and-local revenue increased 4.90%. Seven districts received more of that revenue; Houston’s decline was smaller than its enrollment decline. These cases do not support a blanket explanation that revenue fell proportionately with enrollment. (TEA, n.d.-c; calculations)
After inflation and student-count adjustments, seven districts show increased real state-and-local revenue per student; Houston shows an approximately 1% decline. This still does not determine whether particular facilities were efficient or whether each closure was warranted. (TEA, n.d.-c; BLS, n.d.; calculations)
Inflation-adjusted revenue per student in the case-study districts
Sources: TEA (n.d.-c); BLS (n.d.); calculations. These cover the specified revenue measure, not all unrestricted resources.
District FY2026 adopted-budget outlook
Sources: TEA (n.d.-c, n.d.-e); calculations. These are adopted expectations, not final FY2026 receipts.
Explore the graphic and supporting data using the tabs at the end of this section. Each table can be downloaded as CSV.
Texas Education Fact Check · 05 / 11
Enrollment Fell. Revenue Increased.
Eight case-study districts; actual FY2023–FY2025 changes.
Combined enrollment
Combined state + local M&O operating revenue
| District | Enrollment | Revenue |
|---|---|---|
| Austin | −1.40% | +9.51% |
| Fort Bend | +0.04% | +13.64% |
| Fort Worth | −3.38% | +2.96% |
| Houston | −7.00% | −2.48% |
| Lewisville | −2.43% | +12.01% |
| Plano | −4.76% | +5.02% |
| Richardson | −0.74% | +5.92% |
| San Antonio | −2.66% | +7.59% |
Sources: TEA, n.d.-c. Districts matched by ID. Author calculations. Same district figures appear in the District Actuals table tab.
| District | Enrollment change, FY2023–25 | State-and-local FY2023 | State-and-local FY2025 | Revenue change |
|---|---|---|---|---|
| Austin | −1.40% | $712.2 | $779.9 | +9.51% |
| Fort Bend | +0.04% | $670.8 | $762.3 | +13.64% |
| Fort Worth | −3.38% | $711.8 | $732.9 | +2.96% |
| Houston | −7.00% | $1,666.1 | $1,624.7 | −2.48% |
| Lewisville | −2.43% | $420.2 | $470.7 | +12.01% |
| Plano | −4.76% | $450.4 | $473.0 | +5.02% |
| Richardson | −0.74% | $335.6 | $355.4 | +5.92% |
| San Antonio | −2.66% | $431.7 | $464.5 | +7.59% |
| District | Real state-and-local revenue per student, FY2023–25 |
|---|---|
| Austin | +4.85% |
| Fort Bend | +7.25% |
| Fort Worth | +0.60% |
| Houston | −1.00% |
| Lewisville | +8.38% |
| Plano | +4.11% |
| Richardson | +0.75% |
| San Antonio | +4.35% |
| District | Budgeted state-and-local revenue | Change from FY2025 actual |
|---|---|---|
| Austin | $816.4 million | +4.68% |
| Fort Bend | $840.3 million | +10.23% |
| Fort Worth | $781.3 million | +6.61% |
| Houston | $1,874.4 million | +15.37% |
| Lewisville | $496.1 million | +5.39% |
| Plano | $484.4 million | +2.41% |
| Richardson | $348.9 million | −1.84% |
| San Antonio | $492.0 million | +5.94% |
TEFA funding and closures
Separate General Revenue funding
TEFA awards were not established as direct transfers of public-school districts’ operating allotments into family accounts. SB2 creates the program fund as a separate account within the state’s General Revenue Fund, administered by the Comptroller. Its authorized sources include appropriations, General Revenue transfers, earnings, gifts, grants, donations, and other available money. (Texas Legislature, 2025, § 29.353)
The law expressly prohibits participant-account transfers from being funded with federal money, the Available School Fund, or the state instructional materials and technology fund. These are specific statutory restrictions and should not be expanded into a claim that the subsection expressly prohibits every funding source associated with public education. (Texas Legislature, 2025, § 29.361(g))
SB2 establishes a $1 billion initial biennial spending cap. The LBB’s final fiscal note distinguishes General Revenue program costs from projected Foundation School Fund effects, rather than describing TEFA awards as checks drawn against individual districts’ allotments. (Texas Legislature, 2025, § 29.3521(c-1); LBB, 2025)
The precise finding is that the initial TEFA appropriation was separate from Foundation School Program appropriations and did not finance awards by directly transferring district allotments. “TEFA uses no state education money” is less accurate wording: TEFA itself is state spending for education, and General Revenue also supports public schools. The relevant distinction is separate appropriation versus direct diversion of district funding. (Texas Legislature, 2025, § 29.353; LBB, 2025)
Enrollment effects are separate
Separate appropriations do not prove that TEFA can never affect district finances. The LBB anticipates Foundation School Program savings associated with students leaving public schools. Those are formula-related effects, not the same mechanism as transferring district money into the TEFA fund. (LBB, 2025)
Sources: Texas Legislature (2025, §§ 29.353, 29.361(g)); LBB (2025). The final row states the evidentiary distinction applied in this report.
A separate appropriation also does not resolve the broader policy question of what lawmakers might otherwise have done with General Revenue. That is an opportunity-cost question, not evidence that an existing district appropriation was transferred into TEFA.
The timing matters
TEFA’s first participation year was 2026–27. Actual student participation financed by TEFA therefore cannot explain closures completed in 2024 or 2025. (Texas Comptroller of Public Accounts, n.d.)
Earlier planning could conceivably reflect expectations about future competition, but that is a different claim requiring district records. For closures during or after implementation, the relevant evidence includes how many participating students actually left the district, how enrollment differed from prior projections, how formula revenue changed, and what reasons decision-makers documented.
Neither “TEFA caused these closures” nor “TEFA can never affect district finances” follows from its existence or its separate appropriation. The record supports rejecting a direct-diversion explanation without making an unsupported claim of zero possible future effects. (Texas Legislature, 2025; LBB, 2025)
Explore the graphic and supporting data using the tabs at the end of this section. Each table can be downloaded as CSV.
Texas Education Fact Check · 07 / 11
TEFA Has A Separate Funding Account
Direct allotment transfers and enrollment-related formula effects are different mechanisms.
Separate General Revenue appropriation and other authorized sources
Account within General Revenue · SB2 §29.353
Not a direct transfer of each district’s operating allotment
Sources: Texas Legislature, 2025; LBB, 2025; Texas Comptroller of Public Accounts, n.d.
Texas Education Fact Check · 08 / 11
TEFA Participation Began After The Earlier Closures
A cause-and-effect claim must fit the implementation timeline.
Sources: Texas Legislature, 2025; LBB, 2025; Texas Comptroller of Public Accounts, n.d.. Chronology does not measure later enrollment effects or prove every closure justified.
| Question | Supported answer |
|---|---|
| Did SB2 create a mechanism directly transferring district allotments into TEFA accounts? | No. It establishes a separate General Revenue program account. |
| Does the statute protect specified education funds from participant transfers? | Yes. Section 29.361(g) identifies federal funds, the Available School Fund, and the state instructional-materials fund. |
| Can student departures affect formula funding? | Yes. The fiscal analysis anticipates enrollment-related FSP effects. |
| Does that establish TEFA caused a particular campus closure? | No. Campus-specific causation requires evidence connecting participation, enrollment, revenue, and the decision. |
Districts’ stated reasons
The official records identify enrollment decline and financial pressure alongside facility condition, uneven utilization, program organization, and academic requirements. These are attributed explanations—not independent proof that every decision was necessary.
Sources: Plano ISD; Richardson ISD; Lewisville ISD; Fort Worth ISD; Austin ISD; Fort Bend ISD; Houston ISD; San Antonio ISD.
Explore the graphic and supporting data using the tabs at the end of this section. Each table can be downloaded as CSV.
Texas Education Fact Check · 09 / 11
Districts Cite More Than One Cause
Official explanations vary by district and decision.
Sources: PISD, n.d.; FWISD, n.d.-a; HISD, 2026; AISD, 2025; RISD, 2024; FBISD, 2026; LISD, 2025; SAISD, 2023
| District | Stated reasons | Student arrangements |
|---|---|---|
| Plano | Enrollment decline, uneven utilization, operating savings, avoided capital costs | Boundary changes and placements at remaining schools |
| Richardson | Deficit reduction, underused capacity, enrollment, inflation, funding concerns | Automatic enrollment transfers |
| Lewisville | Enrollment decline, facility efficiency, budget pressure, rising costs | Revised attendance boundaries |
| Fort Worth | Enrollment, demographics, educational competition, infrastructure, resource use | Named receiving campuses and transfer options |
| Austin | Turnaround requirements, program changes, empty seats, budget challenges | Reassignments and transition planning |
| Fort Bend | Aligning capacity with enrollment, programs, resource use | Boundary changes and transition planning |
| Houston | Enrollment, aging facilities, underutilization, sustainability | Receiving campuses, mergers, and some co-locations |
| San Antonio | Long-term enrollment decline, birth rates, housing, oversized building footprint | Mergers and receiving-school placements |
Where students go
Fort Worth’s published assignments illustrate consolidation rather than the loss of an educational placement. (FWISD, n.d.-a)
Source: Fort Worth ISD’s transition information.
Richardson describes automatic enrollment transfers. Houston identifies receiving campuses, continued specialized services, and transition transportation. These arrangements directly address the question of where affected children will attend school. (RISD, 2024; HISD, 2026)
Reassignment does not make closures consequence-free. Transportation, school relationships, neighborhood disruption, program access, and receiving-campus conditions remain legitimate subjects for scrutiny.
Explore the graphic and supporting data using the tabs at the end of this section. Each table can be downloaded as CSV.
Texas Education Fact Check · 10 / 11
The Children Are Reassigned, Not Abandoned
Examples from Fort Worth’s published receiving-school assignments.
Sources: FWISD, n.d.-a; FWISD, n.d.-c; RISD, 2024; HISD, 2026
| Consolidating campus | Receiving schools |
|---|---|
| Edward J. Briscoe Elementary | Carroll Peak, Morningside, Van Zandt-Guinn |
| Milton L. Kirkpatrick Elementary | Washington Heights, Dolores Huerta |
| Charles E. Nash Elementary | Rufino Mendoza, Oakhurst, Versia L. Williams |
| Western Hills Primary | Western Hills Elementary |
| Riverside Applied Learning | Bonnie Brae Elementary |
| De Zavala Elementary | Lily B. Clayton or E. M. Daggett, based on residence |
What the evidence establishes
Campus closure counts alone do not establish wrongdoing by the governor, state administration, or legislative majority. A causal allegation requires evidence connecting a particular action to the outcome. District records identify enrollment, utilization, facilities, budget, and academic considerations. (PISD, n.d.; AISD, 2025; FWISD, n.d.-a; HISD, 2026) ↗ ↗ ↗ ↗ ↗
State accountability requirements are among the documented factors in Austin's decisions; the evidence does not support saying that state policy played no role anywhere. Nor do higher revenues prove that funding was adequate or every consolidation necessary. (AISD, 2025; TEA, n.d.-c) ↗ ↗ ↗ ↗
The supported conclusion is that the meme's mixed-status tally does not establish its implied causal accusation. A separately appropriated TEFA program does not constitute direct diversion of district allotments, although student departures can affect formula funding. (Texas Legislature, 2025; LBB, 2025) ↗ ↗
Public response
A campus closure is not a school district shutting down. Operating Texas public schools increased from 9,180 in 2022–23 to 9,248 in the preliminary 2025–26 directory, a net increase of 68, approximately 0.74%. Over those three transitions, 340 previously operating schools were coded closed. New, returning, and formerly future schools offset those exits. A tally that mixes completed closures and future plans is not a statewide net-loss calculation. (NCES, 2022, 2023, 2024, 2025, 2026) ↗ ↗ ↗ ↗ ↗
Statewide General Fund state revenue plus local M&O property-tax revenue increased 8.50% from FY2023 to FY2025. That does not erase financial pressures: federal revenue declined and operating expenditures grew faster than operating revenue. (TEA, n.d.-c; calculations) ↗
TEFA was separately funded through General Revenue—not by directly transferring district operating allotments into family accounts. Participation began in 2026–27, so actual program-funded departures cannot explain closures completed in 2024 or 2025. Enrollment effects on formula funding require separate evidence. (Texas Legislature, 2025; LBB, 2025; Texas Comptroller of Public Accounts, n.d.) ↗ ↗ ↗
Districts identify receiving schools. Fort Worth's official future schedule even includes two transfers to newly constructed middle schools. Families deserve good transition arrangements, but the listed students are reassigned—not left without an education. (FWISD, n.d.-c) ↗
Short response
The meme mixes completed closures with future plans and omits the distinction between gross closures and statewide net change. From 2022–23 to the preliminary 2025–26 directory, operating public schools increased by 68, even though 340 previously operating schools were coded closed. TEFA was separately appropriated, and its participation began in 2026–27—not in 2024 or 2025. Official district plans identify where affected children will attend school. None of that establishes that every closure was justified, but a closure tally alone does not prove wrongdoing. (TEA, 2024, 2026d; Texas Legislature, 2025; Texas Comptroller of Public Accounts, n.d.; FWISD, n.d.-c) ↗ ↗ ↗ ↗ ↗ ↗ ↗
Methodology and interpretation
- Count operating public schools as directory records coded Open or New. The Texas files used here had no Added, Changed-boundary, or Reopened codes.
- Match school identifiers across consecutive directories. Count a closure only when a school was operating and the next file codes it Closed. Keep inactive and future-status changes separate.
- Do not use the Pocket Edition organization totals, or the 9,105 accountability-universe count, as this operating-school census. Keep TEA’s 9,231 enrollment-report count labeled separately.
- The 2025–26 directory total is preliminary. Do not describe it as the campus count for October 2026 or for the 2026–27 school year.
- Use reporting years rather than publication dates to describe data periods.
- Do not report uncompleted 2026–27 results as historical totals.
- Distinguish campuses, school organizations, districts, and physical buildings.
- Statewide totals include charter campuses and do not describe every district's experience.
- Keep completed closures, approved future actions, and proposals separate.
- Fort Worth's future timeline is a district example, not a statewide pending-closure count.
- Financial actuals and adopted budgets are different measures.
- Separate General Fund and All Funds measures; do not subtract recapture twice or add debt-service taxes to the main operating measure.
- CPI-U is a general purchasing-power adjustment, not a school-specific cost index.
- The eight-district comparison is a case study, not a representative sample.
- Separate TEFA appropriations and enrollment-related formula effects are different questions.
- A gross closure tally does not establish political or legal wrongdoing; nor does rising revenue prove every closure necessary or every policy harmless.
Inspect the Data
Review the published totals, financial comparisons, future schedule, and original-source registry. CSV downloads contain the displayed values, not a substitute for the linked original workbooks.
| School year | Operating public schools | Change | Release |
|---|---|---|---|
| 2021–22 | 9,105 | — | Provisional version 1a |
| 2022–23 | 9,180 | +75 | Provisional version 1a |
| 2023–24 | 9,217 | +37 | Final version 1a |
| 2024–25 | 9,192 | −25 | Final version 1a |
| 2025–26, preliminary | 9,248 | +56 | Preliminary version 0a |
| Statewide measure | FY2023 | FY2024 | FY2025 | FY2023–25 change |
|---|---|---|---|---|
| General Fund state operating revenue | $23.095 | $29.413 | $29.792 | +29.00% |
| General Fund local M&O property-tax revenue | $28.690 | $25.114 | $26.392 | −8.01% |
| Combined state-and-local measure | $51.785 | $54.528 | $56.184 | +8.50% |
| Total General Fund operating revenue | $56.456 | $59.023 | $60.079 | +6.42% |
| General Fund operating expenditures | $55.211 | $59.335 | $62.074 | +12.43% |
| District | Enrollment change, FY2023–25 | State-and-local FY2023 | State-and-local FY2025 | Revenue change |
|---|---|---|---|---|
| Austin | −1.40% | $712.2 | $779.9 | +9.51% |
| Fort Bend | +0.04% | $670.8 | $762.3 | +13.64% |
| Fort Worth | −3.38% | $711.8 | $732.9 | +2.96% |
| Houston | −7.00% | $1,666.1 | $1,624.7 | −2.48% |
| Lewisville | −2.43% | $420.2 | $470.7 | +12.01% |
| Plano | −4.76% | $450.4 | $473.0 | +5.02% |
| Richardson | −0.74% | $335.6 | $355.4 | +5.92% |
| San Antonio | −2.66% | $431.7 | $464.5 | +7.59% |
| Scheduled retirement | Campus | Receiving schools |
|---|---|---|
| June 2027 | A. M. Pate Elementary | C. C. Moss |
| June 2027 | Atwood McDonald Elementary | Bill J. Elliott; East Handley |
| June 2027 | J. T. Stevens Elementary | Westcreek; Bruce Shulkey |
| June 2028 | Harlean Beal Elementary | David K. Sellars |
| June 2028 | Sunrise-McMillan Elementary | Leadership Academy at Maude I. Logan; Maudrie Walton; W. M. Green |
| June 2028 | H. V. Helbing Elementary | Diamond Hill; M. H. Moore |
| June 2029 | Kirkpatrick Middle | Newly constructed J. P. Elder Middle |
| June 2029 | Morningside Middle | Newly constructed William James Middle |
References
Original sources organized by topic. Annotations identify each source’s contribution and reporting scope.
Campus Counts and Reporting Definitions — Sections 2–5
Texas Education Agency. (2023). 2022–2023 Texas school
directory [Data set].
https://tealprod.tea.state.tx.us/Tea.AskTed.Web/Content/TSDFiles/TSD-2023-final.xlsx
Historical administrative directory and explanatory definitions. Included as background. Not used for the operating-school count, which is calculated from the NCES directories.
National Center for Education Statistics. (2022). Common Core of Data public school directory, 2021–22 (version 1a) [Data set]. https://nces.ed.gov/ccd/Data/zip/ccd_sch_029_2122_w_1a_071722.zip
Original school-level directory. The Texas operating-school total of 9,105 matches NCES Table 3: https://nces.ed.gov/ccd/tables/202122_summary_3.asp
National Center for Education Statistics. (2023). Common Core of Data public school directory, 2022–23 (version 1a) [Data set]. https://nces.ed.gov/ccd/Data/zip/ccd_sch_029_2223_w_1a_083023.zip
Fall 2022 starting point for the comparison. The operating-school total is 9,180 and matches NCES Table 3: https://nces.ed.gov/ccd/tables/202223_summary_3.asp
National Center for Education Statistics. (2024). Common Core of Data public school directory, 2023–24 (version 1a) [Data set]. https://nces.ed.gov/ccd/Data/zip/ccd_sch_029_2324_w_1a_073124.zip
Operating-school total of 9,217. It matches NCES Table 3: https://nces.ed.gov/ccd/tables/202324_summary_3.asp
National Center for Education Statistics. (2025). Common Core of Data public school directory, 2024–25 (version 1a) [Data set]. https://nces.ed.gov/ccd/Data/zip/ccd_sch_029_2425_w_1a_073025.zip
Operating-school total of 9,192. It matches NCES Table 3: https://nces.ed.gov/ccd/tables/202425_summary_3.asp
National Center for Education Statistics. (2026, July 14). 2025–26 Common Core of Data (CCD) preliminary directory files [Data set]. https://nces.ed.gov/use-work/dataset/2025-26-common-core-data-ccd-preliminary-directory-files
Preliminary version 0a, October 1, 2025 snapshot. The calculated Texas operating-school total is 9,248. This is not a 2026–27 count. School file: https://nces.ed.gov/ccd/Data/zip/ccd_sch_029_2526_w_0a_050626.zip
Texas Education Agency. (2026e). Highlights of the 2026 state academic accountability results. https://tea2.tea.texas.gov/school-and-district-leaders/accountability/academic-accountability/performance-reporting/highlights-of-2026-state-accountability.pdf
Reports 9,105 campuses in the 2026 accountability universe. That rated-campus count is not used as the organizational census.
Texas Education Agency. (2024, January). Pocket edition: 2022–23 Texas public school statistics. https://tea.texas.gov/about-tea/newsroom/2022-23-tea-pocket-edition.pdf
Original downloadable publication; Organizations table explicitly reports 9,054 campuses for fall 2022, including 905 charter campuses. Published TEA organization total of 9,054 campuses for fall 2022. Not used as the operating-school census in this revision.
Texas Education Agency. (2025, November 13). TEA releases
final 2024–2025 financial accountability ratings.
https://tea.texas.gov/about-tea/newsroom/tea-releases-final-2024-2025-financial-accountability-ratings
Official release reporting traditional districts separately from charter systems.
Texas Education Agency. (2026a). Enrollment in Texas
public schools, 2025–26.
https://tea.texas.gov/data-reports/school-performance/accountability-research/enroll-2025-26.pdf
Published enrollment report containing the 9,231-campus figure and historical enrollment series. Enrollment-report count of 9,231 campuses, excluding state-administered districts. It is 17 below the preliminary NCES operating-school total and is not combined with it.
Texas Education Agency. (2026b). TSDS PEIMS and
accountability: Best practices for the fall submission.
https://tea.texas.gov/school-and-district-leaders/accountability/academic-accountability/performance-reporting/peims-and-accountability-best-practices-for-the-fall-submission.pdf
Official snapshot and submission timeline supporting the separation between current directory records and finalized enrollment reporting.
Texas Education Agency. (2026c, September 2). Fiscal
year 2027 instructional materials entitlements.
https://tea.texas.gov/taa-letters/fiscal-year-2027-instructional-materials-entitlements
Official letter discussing later availability of current-year snapshot enrollment for entitlement adjustments.
Texas Education Agency. (2026d, January). Pocket edition: 2024–25 Texas public school statistics. https://tea.texas.gov/about-tea/newsroom/annual-reports/2025-tea-pocket-edition-annual-report.pdf
Original downloadable publication; Organizations table explicitly reports 9,088 campuses for fall 2024, including 958 charter campuses. Published TEA organization total of 9,088 campuses for fall 2024. Not used as the operating-school census in this revision.
Texas Education Agency. (n.d.-a). AskTED: Download
school and district data file [Data set].
https://tealprod.tea.state.tx.us/Tea.AskTed.Web/Forms/DownloadFile.aspx
Administrative export underlying active-record, construction-status, and district-classification calculations.
Texas Education Agency. (n.d.-b). PEIMS standard
reports: Student enrollment [Data set].
https://rptsvr1.tea.texas.gov/adhocrpt/adste.html
Official student-enrollment report portal. Included for access to the underlying reporting system. The operating-school comparison in this article is calculated from the NCES directories, not the Pocket Editions.
Funding, Budgets, and Inflation — Sections 7–8
Legislative Budget Board. (2024). Fiscal size-up: 2024–25
biennium.
https://www.lbb.texas.gov/Documents/Publications/Fiscal_SizeUp/Fiscal_SizeUp_2024-25.pdf
Original budget reference explaining appropriations and property-tax-relief replacement funding. Used to distinguish state spending increases from additional district resources.
Texas Education Agency. (n.d.-c). Summarized financial
data, 2009–2025 [Data set].
https://tea.texas.gov/finance-and-grants/state-funding/state-funding-reports-and-data/summarized-financial-data-2009-2025.xlsx
Original actual-financial dataset underlying statewide and district-level revenue, expenditure, and enrollment comparisons.
Texas Education Agency. (n.d.-d). About the 2025–2026
PEIMS budget financial data reports.
https://rptsvr1.tea.texas.gov/school.finance/forecasting/financial_reports/AbtBud26.docx
Original definitions supporting distinctions among operating revenue, recapture-adjusted M&O reporting, federal funding, and debt-related revenue.
Texas Education Agency. (n.d.-e). 2026 budget PWR
[Data set].
https://tea.texas.gov/media/423716
Adopted-budget workbook used only for separately labeled FY2026 expectations, not final actual receipts.
Texas Education Agency. (n.d.-f). PEIMS single file financial data downloads. https://tea.texas.gov/about-tea/state-funding/state-funding-reports-and-data/peims-single-file-financial-data-downloads
Official download portal distinguishing actual financial data from adopted budgets.
Texas Education Agency. (n.d.-g). Texas Education Agency 2025 annual report. https://tea.texas.gov/about-tea/newsroom/annual-reports/2025-annual-report.pdf
Original agency publication identifying additional biennial funding under HB2; not added to district budgets a second time.
U.S. Bureau of Labor Statistics. (n.d.). Consumer Price
Index for All Urban Consumers: All items in U.S. city average, not seasonally
adjusted—CUUR0000SA0 [Data set].
https://data.bls.gov/timeseries/CUUR0000SA0
Original CPI-U series underlying the general purchasing-power adjustment. It is not an education-specific or district-specific cost index.
TEFA Law and Implementation — Section 9
Legislative Budget Board. (2025, April 23). Fiscal note,
89th legislative regular session: SB 2, as passed 2nd House.
https://capitol.texas.gov/tlodocs/89R/fiscalnotes/html/SB00002F.htm
Original fiscal analysis distinguishing General Revenue program costs from Foundation School Fund effects. Supports the separate-funding finding while identifying anticipated enrollment-related formula effects.
Texas Comptroller of Public
Accounts. (n.d.). Texas Education Freedom Accounts.
https://educationfreedom.texas.gov/
Official implementation source for the first participation year, 2026–27. Used to separate earlier closures from possible effects after implementation.
Texas Legislature. (2025). Senate Bill 2,
89th Legislature, Regular Session [Enrolled version].
https://capitol.texas.gov/tlodocs/89R/billtext/pdf/SB00002F.pdf
Primary legal authority. Section 29.353 establishes TEFA’s General Revenue account; Section 29.361(g) identifies prohibited sources for participant transfers; Section 29.3521(c-1) establishes the initial biennial cap.
District Decisions and Student Placements — Sections 6 and 10–11
Austin Independent School District. (2025, November 21).
Austin ISD Board approves 24 state-mandated turnaround plans, school consolidation and
programmatic reassignments.
https://www.austinisd.org/press-releases/2025/11/21/austin-isd-board-approves-24-state-mandated-turnaround-plans-school
Official decision record explaining academic requirements, consolidation, program changes, and transition arrangements. Used for the district’s attributed rationale.
Austin Independent School District. (n.d.). Austin ISD
boundary realignment process.
https://www.austinisd.org/boundaries
Current planning information used to distinguish earlier closures from subsequent boundary changes and possible future actions.
Fort Bend Independent School District. (2026). Board
documents and messages.
https://www.fortbendisd.gov/our-district/leadership/board-of-trustees/board-documents-and-messages
Official board-message collection supporting the account of elementary consolidation, capacity, and attendance-boundary decisions.
Fort Worth Independent School District. (n.d.-a). Better
spaces. Greater opportunities.
https://www.fwisd.org/about/betterspaces
Primary source for the multiyear plan, dated actions, and named receiving-campus assignments. Multiyear totals are not treated as counts of closures still pending.
Fort Worth Independent School District. (n.d.-b). Frequently
asked questions.
https://www.fwisd.org/about/betterspaces/frequently-asked-questions
District explanation of demographics, enrollment, infrastructure, staffing, and resource utilization.
Fort Worth Independent School District. (n.d.-c). Boundary maps: Closure timeline. Retrieved October 31, 2026, from https://www.fwisd.org/about/betterspaces/boundary-maps
Official campus-by-campus retirement schedule with effective years and receiving schools. Supports the eight future entries for June 2027–2029, including two newly constructed receiving middle schools.
Houston Independent School District. (2026, February 27).
HISD moves forward with school closures to address underutilization and sustain
progress.
https://hisdnow.houstonisd.org/p/~board/district-news/post/hisd-moves-forward-with-school-closures-to-address-underutilization-and-sustain-progres
Official explanation distinguishing closures, mergers, and co-locations; also documents student placements, services, and transportation.
Lewisville Independent School District. (2025, August 26).
Lewisville ISD adopts 2025–26 budget and tax rate.
https://www.lisd.net/news/~board/all-district-news/post/lewisville-isd-adopts-2025-26-budget-and-tax-rate
District statement addressing school retirements, enrollment, financial pressures, and compensation obligations.
Plano Independent School District. (n.d.). Approved long
range facility plan.
https://www.pisd.edu/about-our-district/long-range-facility-plan/approved-plan
Approved district plan supporting the attributed enrollment, utilization, operating, capital, and attendance-boundary explanations.
Richardson Independent School District. (2024). RISD
Board approves elementary school consolidation plan.
https://web.risd.org/home/risd-board-approves-elementary-school-consolidation-plan/
Official consolidation record explaining financial and capacity concerns and automatic enrollment reassignment.
San Antonio Independent School District. (2023). SAISD
announces final rightsizing recommendation; Board deliberates and votes Monday, Nov. 13.
https://www.saisd.net/article/2201706
District explanation of demographic trends, housing, utilization, and receiving-school planning.