
What The Current Texas Tax System Costs Texas Households
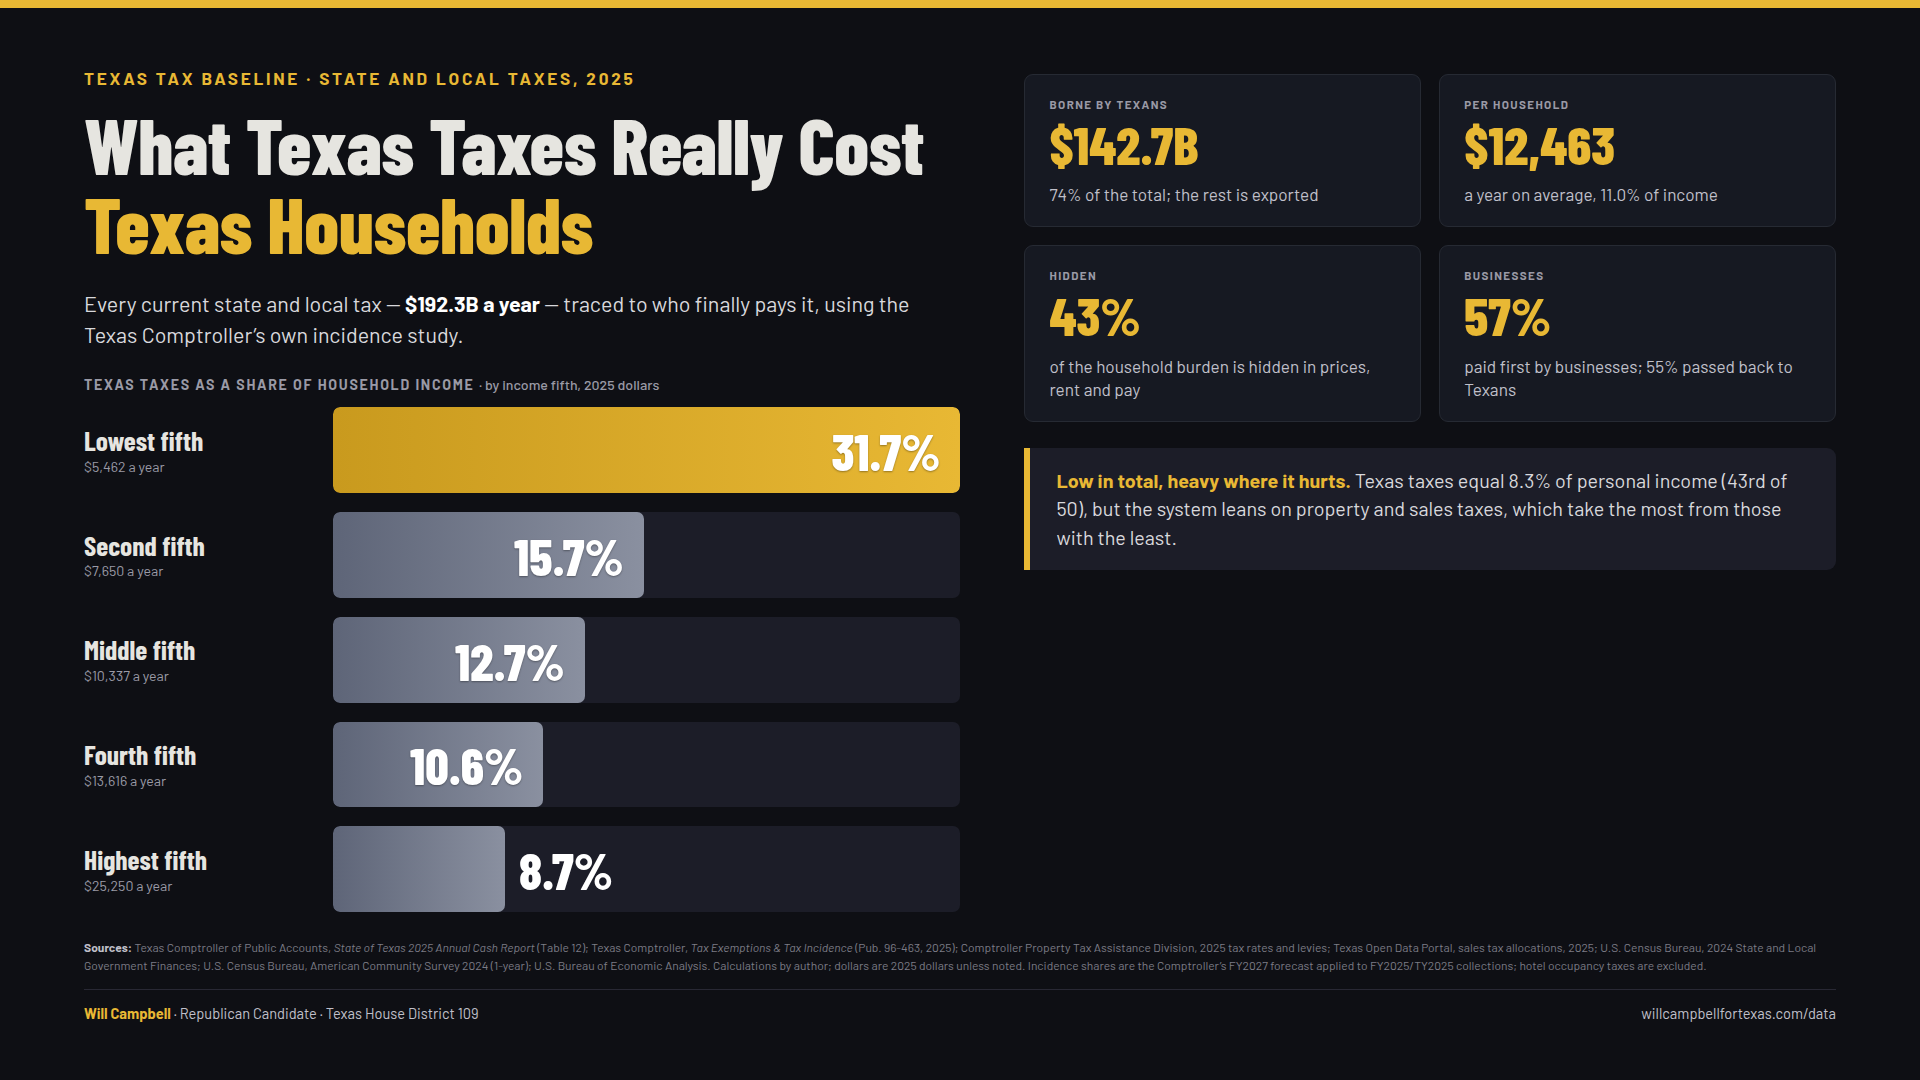
What the Current Texas Tax System Costs Texas Households
Every current state and local tax in Texas — about $192.3B a year — traced to the households who actually bear it, using the Texas Comptroller’s own incidence study. What families pay at the register, what is hidden in prices, rent and paychecks, how the burden falls on every income group and on Texas businesses, which level of government taxes most, and how Texas compares with other states — statewide, in Dallas County and in South Dallas County’s House District 109.
Executive Summary
What the current Texas tax system costs Texans, in brief
This analysis counts every current Texas state and local tax — from the state sales and franchise taxes to the property taxes levied by school districts, counties, cities and special districts — and follows each one to the households that finally bear it, using the Comptroller’s own incidence study (TCPA, 2025b). It then relates that burden to household income, spending, rent, living costs and the people of Texas; shows what Texas businesses pay and which level of government — the State, counties, cities, school districts or special districts — taxes most; and compares Texas with the other states, statewide, in Dallas County and in House District 109.
- The system is large. Texas state and local governments collect $192.3B a year in current taxes. Texas households bear $142.7B of it (74%); the rest falls on people and businesses outside Texas (Sections 1–2).
- The average household pays about $12,463 a year. That is 11.0% of the average household’s income, and 43% of it never appears on a tax bill — it is hidden in prices, rent, wages and investment returns (Sections 3–4).
- It takes the most from those with the least. The lowest-income fifth of households gives up 31.7% of its income to Texas taxes, about 16 weeks of income a year; the highest-income fifth gives up 8.7%, about 4.5 weeks. On the Comptroller’s broader income measure the shares are about 24% and 6% — lower, but the same pattern (Section 3).
- Property tax is the biggest piece, and renters pay it too. Property taxes are 47% of all current Texas taxes. The average renter household bears $12,456 a year in Texas taxes, about the same as a homeowner household ($12,467), on roughly half the income (Section 5).
- Families renting houses carry the owner’s whole tax bill. A Texas family renting a house or townhome pays about $5,541 a year in property tax through the rent, compared with $2,257 for an apartment renter; Texas renters together pay about $14.3B a year that way (Section 5).
- Basic needs include a large tax bill. A single adult in Texas needs $45,290 a year to cover basic needs, and about $7,902 of that goes to Texas state and local taxes — 9.1 weeks of work (Section 7).
- The heaviest load falls on families with the lowest typical incomes. At their median incomes, Texas taxes take an estimated 19.9% from single mothers, 14.4% from Black households and 14.0% from Hispanic households, compared with 10.7% from married couples with children (Section 10).
- Businesses write most of the checks. Businesses pay first on 57% of current Texas taxes ($110.5B), one of the largest business shares of any state, including 14 taxes levied only on businesses; about 55% of what they pay is passed back to Texas households in prices, wages and returns (Section 11).
- Low in total, heavy where it hurts. Texas collects less than most states — 8.3% of personal income, 43rd of 50 — but relies on property tax more than all but two states, and independent researchers rank its system among the ten most regressive in the nation (Section 12).
- Local governments collect more than the State. The State is the largest single taxing tier ($85.6B, 44% of all taxes), but counties, cities, school districts and special districts together collect $106.8B (56%). School districts are the largest local tier at $41.7B, about $2,585 per household, and every tier takes the largest share of income from the lowest-income households (Section 13).
- Close to home. Dallas County households bear about $12,615 a year (11.1% of income), and House District 109 households about $11,656 (12.0%). The district’s lowest-income fifth gives up 30.0% of its income, and the average district renter pays $4,002 a year in property tax inside the rent (Sections 8–9).
Taken together, the current Texas tax system collects less than most states but takes the largest share of income from households with the least, much of what Texans pay is hidden from the people paying it, and more than half of what businesses pay comes back to Texas households. The State is the largest single taxing tier, but local governments together, led by school districts, collect more (Sections 13–14).
| Measure | Value | Section |
|---|---|---|
| All current Texas state and local taxes | $192.3B | 1 |
| Borne by Texas households | $142.7B (74%) | 2 |
| Borne outside Texas | $49.6B | 2 |
| Average Texas taxes per household | $12,463 (11.0% of income) | 3 |
| Hidden in prices, rent and wages | 43% | 4 |
| Lowest-income fifth: share of income | 31.7% (16 weeks) | 3 |
| Highest-income fifth: share of income | 8.7% (4.5 weeks) | 3 |
| Average renter household / homeowner household | $12,456 / $12,467 | 5 |
| Property tax inside rent: house renter / apartment renter | $5,541 / $2,257 | 5 |
| Paid first by businesses | $110.5B (57%) | 11 |
| Taxes as share of personal income, Texas vs. U.S. | 8.3% vs. 10.1% | 12 |
| Largest taxing tier: State / largest local tier: school districts | $85.6B / $41.7B | 13 |
| House District 109: per household | $11,656 (12.0% of income) | 9 |
| Income group | Mean income | Texas taxes per household | Share of income | Weeks of income |
|---|---|---|---|---|
| Lowest fifth | $17,223 | $5,462 | 31.7% | 16.5 |
| Second fifth | $48,725 | $7,650 | 15.7% | 8.2 |
| Middle fifth | $81,206 | $10,337 | 12.7% | 6.6 |
| Fourth fifth | $128,146 | $13,616 | 10.6% | 5.5 |
| Highest fifth | $290,434 | $25,250 | 8.7% | 4.5 |
| All households | $113,147 | $12,463 | 11.0% | 5.7 |
| Measure | Texas | U.S. | Rank |
|---|---|---|---|
| State and local taxes per person | $5,670 | $7,230 | 33 of 50 |
| State and local taxes as share of personal income | 8.3% | 10.1% | 43 of 50 |
| Property tax share of all state and local taxes | 40.9% | 29.4% | 3 of 50 |
| Effective homeowner property tax rate (median tax ÷ median value) | 1.31% | — | 8 of 50 |
| Business share of state and local taxes (EY/COST) | 59.5% | 45.8% | 5 of 50 |
| ITEP regressivity rank (1 = most regressive) | 7th | — | 7 of 50 |
The Whole Tax System, Counted
Every current state and local tax, from the Capitol down to the special district
Most conversations about Texas taxes stop at two: the property tax bill and the sales tax on a receipt. The real system is much larger, and most of it never shows up on either. To measure what Texans actually carry, this analysis starts by counting every current tax at every level of government.
The State of Texas collected $85.6B in taxes in fiscal year 2025, from the sales and motor vehicle taxes to the franchise, oil and gas production, insurance, fuel, tobacco, alcohol and utility taxes, including the unemployment tax employers pay into the state’s unemployment trust fund (Texas Comptroller of Public Accounts [TCPA], 2025a). Local governments levied $89.4B in property taxes for tax year 2025: $41.7B by school districts, $16.8B by counties, $16.7B by cities and $14.3B by special districts such as hospital, water, college and emergency services districts (Texas Comptroller of Public Accounts, Property Tax Assistance Division [PTAD], 2026a). Cities, counties, transit authorities and special purpose districts received $14.4B in local sales tax in calendar 2025 (TCPA, 2026c). Local utility, vehicle registration, license and other taxes added another $2.9B (U.S. Census Bureau, 2026a).
One set of taxes is deliberately left out. State and local hotel occupancy taxes, about $2.6B a year, are charged to whoever stays in a Texas hotel room, and many of those guests are not Texas households. In 2024, 62 million travelers visited Texas from across the country and around the world, alongside more than 67 million Texans who took overnight trips within the state (Office of the Governor, 2025). Many hotel stays are also business travel paid for by employers. Because much of this tax is paid by visitors and businesses rather than Texas families, and no authoritative source divides it among them, it is excluded rather than estimated.
Together, that is $192.3B in current Texas state and local taxes. Property taxes are the largest single piece at 47%, and sales and use taxes are second at 33%.
Tax incidence is who finally bears the cost of a tax, as opposed to who writes the check. A store remits sales tax, but the shopper pays it. A landlord pays the property tax, but the tenant pays it through rent. A refinery pays a production tax, but part of it reaches drivers at the pump, workers through pay and owners through lower returns.
| Tax family | Amount | Share of total | Borne by Texas households | Exported share |
|---|---|---|---|---|
| Property taxes | $89.45B | 46.5% | $63.57B | 28.9% |
| Sales and use taxes | $63.59B | 33.1% | $50.72B | 20.2% |
| Motor vehicle taxes | $7.65B | 4.0% | $7.04B | 7.9% |
| Franchise and business taxes | $9.28B | 4.8% | $5.85B | 36.9% |
| Oil and gas production taxes | $8.00B | 4.2% | $2.85B | 64.4% |
| Insurance taxes | $4.51B | 2.3% | $4.03B | 10.5% |
| Motor fuel taxes | $3.92B | 2.0% | $3.28B | 16.2% |
| Tobacco and alcohol taxes | $2.93B | 1.5% | $2.93B | 0.0% |
| Utility and other taxes | $3.03B | 1.6% | $2.42B | 20.2% |
| All current Texas taxes | $192.35B | 100.0% | $142.70B | 25.8% |
Who Really Pays
Following each tax from the business that remits it to the household that bears it
Texas law requires the Comptroller to study who ultimately pays the state’s major taxes. The most recent edition, published in January 2025, traces eight taxes — the sales, motor vehicle sales, franchise, oil production, natural gas production, gasoline, insurance premium and school property taxes — from the people and industries that first pay them to the households that finally bear them, sorted into five equal groups of Texas households by income (TCPA, 2025b).
The study shows how much of each tax is first paid by businesses rather than by individuals. Individual consumers make 58.6% of sales tax payments; businesses pay the other 41.4% on the supplies, equipment and services they buy. For the school property tax, homeowners make 41.5% of the payments, and owners of business, rental, mineral and other property make the rest. For the franchise, production and insurance premium taxes, businesses make all of the payments (TCPA, 2025b).
Those business payments do not stay with businesses. The study traces them forward into the prices Texans pay and the rent they owe, and backward into the wages Texans earn and the returns Texas owners receive. It also measures how much is exported: borne by out-of-state shoppers, visitors and owners. Applying those shares to every current Texas tax gives this picture:
- $81.8B (42.5%) is paid directly and visibly by Texas households — at the register, on the property tax bill, at the title office and at the pump.
- $60.9B (31.7%) reaches Texas households indirectly — built into prices, rent, insurance premiums and utility bills, or taken out of paychecks and investment returns.
- $49.6B (25.8%) is exported to non-residents.
“Of every dollar in Texas taxes that Texas households bear, about 43 cents never appears on a receipt or a tax bill.”— Calculations by author from the Texas Comptroller’s tax incidence study and FY2025 collections
The study reports its distributions for fiscal 2027. This analysis applies those shares to actual FY2025 and TY2025 collections. Local sales taxes use the state sales tax distribution because they share the same base. City, county and special district property taxes use the school property tax distribution because they are levied on the same appraisal rolls. About 4% of the total (diesel, utility, payroll, license and smaller taxes) is assigned to the nearest Comptroller distribution, and tobacco and alcohol taxes follow Texas spending on those products (U.S. Bureau of Labor Statistics [BLS], 2024). The study also predates the increase in the school homestead exemption from $100,000 to $140,000 for tax year 2025 (TCPA, 2026b), so the homeowner share of property tax is likely somewhat lower today than shown.
What Each Household Bears
All current Texas taxes per household, by income group
Texas has 11,449,769 households (U.S. Census Bureau, 2025). Divided into five equal groups (quintiles) of about 2,289,954 households each, the average household in each group bears the following in current Texas state and local taxes.
In dollars, higher-income households bear more: the top fifth carries $25,250 a year, about 4.6 times the $5,462 borne by the bottom fifth. As a share of income, it runs the other way. The bottom fifth gives up 31.7% of its income to Texas taxes — about 16 weeks of a year’s income — while the top fifth gives up 8.7%, about 4.5 weeks. The middle fifth, with a mean income of $81,206, gives up 12.7%.
The Comptroller’s own figures point the same way. For just the eight taxes in its study, the bottom fifth pays 16.0% of its total income and the top fifth pays 4.0% (TCPA, 2025b). The study measures income more broadly than the Census Bureau does, which is why its percentages are lower than the all-tax figures above.
How income is measured changes the levels, but not the pattern. The Census Bureau’s household money income, used throughout this article, leaves out non-cash benefits such as SNAP and Medicaid and excludes capital gains (U.S. Census Bureau, 2025). The Comptroller counts a broader income: adjusted gross income plus untaxed interest, pensions and Social Security, and the income of households too poor to file a tax return (TCPA, 2025b). Measured against the Comptroller’s broader income, all current Texas taxes take about 24% of the lowest fifth’s income and about 6% of the highest fifth’s, instead of 31.7% and 8.7%. On either measure, the lowest-income households give up roughly 4 times the share the highest-income households do (see the Income Measures tab).
Income is the measure used throughout this analysis, because it is what a household has to pay its taxes from. As a secondary check, the burden can also be compared with what households spend. The lowest-income fifth includes many retirees, students and people between jobs; in the federal spending survey, that group spent about $37,045 a year (2025 dollars) on reported income of about $14,344, and the average head of household was 55.9 years old (BLS, 2024). Against spending, Texas taxes take about 15% for the bottom fifth and 18% for the top fifth. That comparison does not change the income picture: the households with the least income give up the largest share of it.
| Household group | Income range (2024) | Mean income | Texas taxes | Direct | Indirect | Share of income | Weeks of income |
|---|---|---|---|---|---|---|---|
| Lowest fifth (Q1) | Under $33,235 | $17,223 | $5,462 | $2,842 | $2,620 | 31.7% | 16.5 |
| Second fifth (Q2) | $33,235–$62,908 | $48,725 | $7,650 | $4,148 | $3,502 | 15.7% | 8.2 |
| Middle fifth (Q3) | $62,908–$100,044 | $81,206 | $10,337 | $5,697 | $4,640 | 12.7% | 6.6 |
| Fourth fifth (Q4) | $100,044–$160,370 | $128,146 | $13,616 | $7,947 | $5,669 | 10.6% | 5.5 |
| Highest fifth (Q5) | $160,370 and up | $290,434 | $25,250 | $15,094 | $10,156 | 8.7% | 4.5 |
| All households | — | $113,147 | $12,463 | $7,146 | $5,317 | 11.0% | 5.7 |
| Income group | Texas taxes per household | Census mean income (2025) | Share of Census income | Comptroller mean income (FY2027) | Share of Comptroller income |
|---|---|---|---|---|---|
| Lowest fifth | $5,462 | $17,223 | 31.7% | $22,488 | 24.3% |
| Second fifth | $7,650 | $48,725 | 15.7% | $55,114 | 13.9% |
| Middle fifth | $10,337 | $81,206 | 12.7% | $89,928 | 11.5% |
| Fourth fifth | $13,616 | $128,146 | 10.6% | $149,573 | 9.1% |
| Highest fifth | $25,250 | $290,434 | 8.7% | $407,697 | 6.2% |
Paid at the Register vs. Hidden in Prices
Where each household’s Texas tax burden comes from
A household sees only part of its tax burden. The rest arrives through channels that never carry a tax label.
- Sales tax on business purchases. Groceries, rent and residential utilities are generally not taxed at checkout (Tex. Tax Code ch. 151, 2025), and merchandise a store buys to resell is exempt as well (TCPA, 2025b). But businesses do pay sales tax on the equipment, supplies and taxable services they use to operate — 41% of all state sales tax payments — and that cost moves into the prices of what they sell (TCPA, 2025b).
- Property tax on business and rental property. Taxes on stores, offices, factories, apartments and rental homes reach households through prices and rent. This is the largest hidden piece of the system.
- Franchise, production and insurance premium taxes. These are paid entirely by businesses and reach households through prices, insurance premiums, wages and investment returns (TCPA, 2025b).
- Excise taxes. Cigarette, tobacco, alcohol and diesel taxes are paid upstream and built into the shelf or pump price.
Property and sales taxes dominate every income group. For the bottom fifth, property taxes alone come to $2,320 a year even though most households in that group rent, and only $1,029 of it is paid directly on a homeowner’s bill. Sales and use taxes add $1,991, of which $523 is built into prices.
| Tax family | Q1 | Q2 | Q3 | Q4 | Q5 | Hidden share |
|---|---|---|---|---|---|---|
| Property taxes | $2,320 | $3,126 | $4,184 | $5,821 | $12,308 | 42% |
| Sales and use taxes | $1,991 | $2,922 | $3,941 | $4,841 | $8,453 | 27% |
| Motor vehicle taxes | $276 | $368 | $483 | $833 | $1,116 | 37% |
| Motor fuel taxes | $160 | $220 | $305 | $332 | $417 | 34% |
| Franchise and business taxes | $160 | $284 | $446 | $590 | $1,075 | 100% |
| Insurance taxes | $222 | $237 | $365 | $435 | $502 | 100% |
| Oil and gas production taxes | $79 | $128 | $185 | $301 | $551 | 100% |
| Tobacco and alcohol taxes | $159 | $225 | $240 | $232 | $424 | 71% |
| Utility and other taxes | $95 | $139 | $188 | $231 | $403 | 100% |
| All taxes | $5,462 | $7,650 | $10,337 | $13,616 | $25,250 | 43% |
Renters Pay Too
How the burden divides between homeowners and renters
Renters never receive a property tax bill, but the Comptroller’s study assigns renter households 28.4% of the school property tax and homeowner households 42.7%; the rest is exported (TCPA, 2025b). Texas has 7,134,877 owner households and 4,314,892 renter households (U.S. Census Bureau, 2025). Applying the Comptroller’s tenure shares to every current Texas tax gives these averages:
On average, renter households bear about the same dollars in Texas taxes as owner households — $12,456 compared with $12,467 — on a median income that is roughly half as large ($54,387 compared with $101,734) (TCPA, 2025b) (U.S. Census Bureau, 2025). In the Comptroller’s distribution, renter households also carry more property tax per household than owner households; rental homes and apartments do not qualify for the residence homestead exemption that lowers a homeowner’s taxable value (TCPA, 2026b).
Renting is concentrated at the bottom of the income ladder. In the federal spending survey, 55% of the lowest-income fifth of Texas households rent, compared with 14% of the highest-income fifth (BLS, 2024). For those households, almost all of the property tax they bear is invisible.
How Much of the Rent Check Pays the Landlord’s Property Tax
Every rental owner pays a property tax bill and sets the rent to cover it, but how large that bill is relative to the rent depends on the kind of home. For apartments, owners’ own books show the share. The National Apartment Association’s Dollar of Rent data, built from standardized apartment operating statements (16,353 properties in its 2024 dataset), puts the Texas average at 14.4% of rent revenue in 2025 — 15.9% for market-rate apartments and 13.2% for income-restricted ones. In the Dallas metro the figures are 15.9% and 17.3% (National Apartment Association [NAA], 2025). Two years earlier the shares were higher: in 2023, property taxes took 17.4% of market-rate rent statewide, 17.9% in Dallas, and 19.5% in Austin and San Antonio (NAA, 2025). The Texas Apartment Association told the Senate Finance Committee in 2024 that “approximately 20% of every rent dollar paid by Texas renters goes toward property taxes” (Texas Apartment Association [TAA], 2024), and separate 2026 data put property taxes at 18.1% of market-rate apartment income in Austin, 15.9% in Dallas and 15.6% in Fort Worth (Bajomo, 2026). Texas is well above the national average of about 10% (NAA, 2025).
Houses and Townhomes: The Whole Tax Bill Moves Into the Rent
A family renting a house or townhome is in a different position. The owner of a single rental home pays the full property tax bill on that home and sets the rent to cover it, and rental homes receive no residence homestead exemption (TCPA, 2026b), so the entire appraised value is taxed at the combined rate of every taxing unit. In tax year 2025 those rates averaged about 2.19% of value statewide for a home inside a city — school districts 1.01%, cities 0.53%, counties 0.35% and special districts about 0.30% (PTAD, 2026a). In House District 109’s core cities the combined rate runs from 2.30% in Cedar Hill to 2.44% in DeSoto (PTAD, 2026a).
The Census Bureau does not publish the value of rented homes, so this analysis brackets it between the lower-quartile and median values of owner-occupied homes in each area (U.S. Census Bureau, 2025) (U.S. Census Bureau, 2026b). On that basis, the owner of a typical Texas rental house pays $4,223 to $6,860 a year in property tax — about $5,541 at the midpoint, or $462 a month, roughly 32% of the rent. A Texas apartment renter carries about $2,257 a year, 14.4% of the rent (NAA, 2025) (PTAD, 2026a) (U.S. Census Bureau, 2025). The house renter pays more than twice as much property tax through rent.
This matters because 31% of Texas renter households — 1,337,525 — live in single-family homes or townhomes, and another 12% live in duplexes and other small buildings of two to four units (U.S. Census Bureau, 2025). Counting every type of rental, the average Texas renter household pays about $3,315 a year in property tax through rent, $14.3B across all renters (NAA, 2025) (PTAD, 2026a) (U.S. Census Bureau, 2025). That is only part of what renters carry: the Comptroller’s study assigns the average renter household about $5,883 a year in property tax across every channel (TCPA, 2025b). The rest, about $2,568, reaches renters through the prices of groceries, services and everything else sold from taxed stores, offices and warehouses.
For apartment renters, other published measures put the share the same or higher. The Apartments by Source tab below applies each one to the same apartment renters, including the figure the Texas Apartment Association presented to the Senate Finance Committee.
| Tenure | Households | Median income (2024) | Property taxes borne | All Texas taxes borne | Taxes vs. median income |
|---|---|---|---|---|---|
| Owner households | 7,134,877 | $101,734 | $5,351 | $12,467 | 12.3% |
| Renter households | 4,314,892 | $54,387 | $5,883 | $12,456 | 22.9% |
| Area | Rental type | Renter households (share) | Est. rent per month | Property tax in rent (per year) | Range | Share of rent |
|---|---|---|---|---|---|---|
| Texas | Single-family home or townhome | 1,337,525 (31%) | $1,434 | $5,541 | $4,223–$6,860 | 32% |
| Small multifamily (2–4 units) | 533,998 (12%) | $1,090 | $3,049 | $1,888–$4,210 | 23% | |
| Apartment (5+ units) | 2,260,516 (52%) | $1,303 | $2,257 | — | 14% | |
| Mobile home / other | 182,853 (4%) | $877 | $891 | — | 8% | |
| All renters | 4,314,892 (100%) | $1,299 | $3,315 | $2,763–$3,868 | 21% | |
| Dallas County | Single-family home or townhome | 102,558 (21%) | $1,594 | $5,681 | $4,616–$6,747 | 30% |
| Small multifamily (2–4 units) | 51,456 (11%) | $1,290 | $3,526 | $2,454–$4,598 | 23% | |
| Apartment (5+ units) | 324,832 (67%) | $1,405 | $2,673 | — | 16% | |
| Mobile home / other | 4,980 (1%) | $921 | $936 | — | 8% | |
| All renters | 483,826 (100%) | $1,428 | $3,383 | $3,043–$3,723 | 20% | |
| House District 109 | Single-family home or townhome | 9,652 (52%) | $1,608 | $5,467 | $4,606–$6,329 | 28% |
| Small multifamily (2–4 units) | 1,440 (8%) | $1,097 | $2,908 | $2,086–$3,729 | 22% | |
| Apartment (5+ units) | 6,533 (35%) | $1,332 | $2,534 | — | 16% | |
| Mobile home / other | 955 (5%) | $869 | $883 | — | 8% | |
| All renters | 18,580 (100%) | $1,436 | $4,002 | $3,491–$4,513 | 23% |
| Source | Texas share | Texas apartment renter (per year) | All Texas apartment renters (per year) | Dallas-area share | HD109 apartment renter (per year) | All HD109 apartment renters (per year) |
|---|---|---|---|---|---|---|
| NAA Dollar of Rent, all apartments, 2025 (used in this analysis) | 14.4% | $2,257 | $5.10B | 15.9% | $2,534 | $17M |
| NAA Dollar of Rent, market-rate apartments, 2025 | 15.9% | $2,481 | $5.61B | 17.3% | $2,767 | $18M |
| NAA Dollar of Rent, market-rate apartments, 2023 | 17.4% | $2,719 | $6.15B | 17.9% | $2,855 | $19M |
| NAA Expense Watch (Yardi Matrix), market-rate, 2026 | — | — | — | 15.9% | $2,542 | $17M |
| Texas Apartment Association testimony to the Senate Finance Committee, 2024 | 20.0% | $3,127 | $7.07B | 20.0% | $3,198 | $21M |
What Texas Households Spend
The spending patterns that carry the tax burden
Taxes travel through spending, so where households spend shapes where taxes land. The most recent Texas-specific spending survey by income group covers 2022–2023; the Bureau of Labor Statistics stopped producing state tables in 2026, making it the final edition (BLS, 2024) (BLS, 2026). The figures below are converted to 2025 dollars using the Dallas–Fort Worth consumer price index for each category (BLS Southwest Information Office, 2026).
Housing takes 43% of what the bottom fifth spends and 29% of what the top fifth spends. Groceries, utilities and transportation also take larger shares at the bottom. Those are the categories where hidden property, sales and business taxes are embedded in rent, prices and bills.
The federal spending survey captures about half of all Texas consumer spending recorded in the national accounts — roughly 43% of restaurant spending and 40% of clothing (BLS, 2024) (U.S. Bureau of Economic Analysis [BEA], 2026b). That is one reason this analysis takes the level of directly paid sales tax from the Comptroller’s study and uses the survey only to divide it among income groups.
| Category | Q1 | Q2 | Q3 | Q4 | Q5 | All |
|---|---|---|---|---|---|---|
| Total spending | $37,045 | $51,419 | $59,627 | $82,879 | $140,351 | $75,328 |
| Groceries | $3,051 | $3,455 | $4,442 | $5,699 | $7,751 | $4,914 |
| Restaurants and takeout | $2,014 | $2,410 | $3,533 | $4,386 | $9,358 | $4,380 |
| Housing (all) | $15,774 | $19,213 | $20,550 | $26,813 | $41,097 | $24,965 |
| Rent | $6,133 | $6,790 | $5,560 | $6,215 | $4,363 | $5,791 |
| Owned home costs | $3,586 | $4,449 | $6,008 | $8,597 | $18,293 | $8,357 |
| Utilities and phone | $3,753 | $4,573 | $5,395 | $6,052 | $7,423 | $5,483 |
| Transportation (all) | $7,955 | $7,210 | $12,795 | $16,662 | $26,450 | $14,444 |
| Vehicle purchases | $3,511 | $1,473 | $4,710 | $6,670 | $12,984 | $5,990 |
| Gasoline | $1,573 | $1,999 | $2,676 | $3,005 | $3,539 | $2,583 |
| Health care | $2,922 | $4,335 | $4,408 | $6,254 | $8,947 | $5,443 |
| Entertainment | $1,195 | $1,977 | $1,909 | $3,311 | $8,207 | $3,377 |
| Apparel | $832 | $877 | $1,515 | $1,632 | $3,734 | $1,734 |
| Education | $235 | $194 | $644 | $900 | $2,257 | $869 |
| Personal insurance and pensions | $676 | $2,520 | $5,603 | $11,137 | $22,060 | $8,656 |
| Income before taxes (survey) | $14,344 | $37,834 | $65,534 | $111,789 | $248,382 | $98,312 |
Families and Single Adults
The living-wage test, Texas and Dallas County
Texas has 7,739,539 family households, including 5,574,265 married couples and 2,165,274 single-parent and other families, and 3,013,974 people who live alone — 26% of all households (U.S. Census Bureau, 2025). The MIT Living Wage Calculator estimates what each kind of household needs to cover basic needs without assistance, for Texas as a whole and for each county (Glasmeier, 2026b) (Glasmeier, 2026a). MIT does not publish figures for state House districts; House District 109 lies within Dallas County, so the Dallas County budgets apply there.
Statewide, a single adult needs $45,290 a year before taxes — $21.77 an hour full time — to cover basic needs, and about $7,902 of that budget goes to Texas state and local taxes, roughly 9.1 weeks of work (Glasmeier, 2026b). A family of four with two working parents needs $101,697, of which about $12,011 goes to Texas taxes. Dallas County costs more: a single adult there needs $48,489 ($23.31 an hour), with about $7,672 going to Texas taxes, and a two-earner family of four needs $107,251, with about $12,400 in Texas taxes (Glasmeier, 2026a). Because Texas taxes take a smaller share of income as income rises, the larger Dallas County budgets carry only modestly more in Texas taxes, and for a single adult slightly less ($7,672 vs. $7,902 statewide). MIT notes that its budgets already include sales and property taxes within the cost of food, housing and other needs (Glasmeier, 2026c); these estimates show how large that embedded share is.
| Household | Living wage (per worker, hourly) | Required income before taxes | Housing | Est. Texas taxes borne | Share of income | Weeks of income |
|---|---|---|---|---|---|---|
| 1 adult, 0 children | $21.77 | $45,290 | $14,679 | $7,902 | 17.4% | 9.1 |
| 1 adult, 1 child | $35.77 | $74,391 | $18,418 | $9,933 | 13.4% | 6.9 |
| 1 adult, 2 children | $44.95 | $93,487 | $18,418 | $11,386 | 12.2% | 6.3 |
| 2 adults (1 working), 2 children | $37.39 | $77,772 | $18,418 | $10,144 | 13.0% | 6.8 |
| 2 adults (both working), 0 children | $14.67 | $61,036 | $15,452 | $8,896 | 14.6% | 7.6 |
| 2 adults (both working), 2 children | $24.45 | $101,697 | $18,418 | $12,011 | 11.8% | 6.1 |
| Household | Living wage (per worker, hourly) | Required income before taxes | Housing | Est. Texas taxes borne | Share of income | Weeks of income |
|---|---|---|---|---|---|---|
| 1 adult, 0 children | $23.31 | $48,489 | $17,805 | $7,672 | 15.8% | 8.2 |
| 1 adult, 1 child | $37.90 | $78,832 | $21,732 | $10,206 | 12.9% | 6.7 |
| 1 adult, 2 children | $47.71 | $99,239 | $21,732 | $11,830 | 11.9% | 6.2 |
| 2 adults (1 working), 2 children | $38.88 | $80,866 | $21,732 | $10,319 | 12.8% | 6.6 |
| 2 adults (both working), 0 children | $15.39 | $64,034 | $18,547 | $9,157 | 14.3% | 7.4 |
| 2 adults (both working), 2 children | $25.78 | $107,251 | $21,732 | $12,400 | 11.6% | 6.0 |
Dallas County
The county picture, measured the same way
The statewide pattern holds in Dallas County. To compare places on the same footing, this section and the next use the Census Bureau’s 2020–2024 five-year estimates, which are the only Census income data published for state House districts (U.S. Census Bureau, 2026b). Dallas County has 982,737 households with a median income of $76,547, close to the statewide five-year median of $78,476. Its lowest-income fifth averages $17,983 a year and its highest $298,112 (U.S. Census Bureau, 2026b).
No official study traces Texas taxes for a single county, so this analysis applies the statewide burden at each income level to Dallas County’s own income groups. On that basis, Dallas County households bear an estimated $12.40B a year in current Texas state and local taxes — about $12,615 per household, or 11.1% of income.
Half of Dallas County households rent (483,826 of 982,737), compared with 37% statewide (U.S. Census Bureau, 2026b). With more renters, more of the county’s tax burden arrives through rent rather than on a tax bill. Most Dallas County renters (67%) live in apartments, where property tax takes about $2,673 a year of the rent; the 21% who rent a house or townhome carry about $5,681. Across all of the county’s renters, property tax inside rent comes to about $1.64B a year (NAA, 2025) (PTAD, 2026a) (U.S. Census Bureau, 2026b). Dallas County homeowners who do get a bill report paying more than the state average: a median of $4,798 a year, compared with $4,232 statewide over the same five years (U.S. Census Bureau, 2026b).
| Income fifth | Households | Mean income | Texas taxes | Direct | Indirect | Share of income |
|---|---|---|---|---|---|---|
| Q1 | 196,547 | $18,217 | $5,685 | $2,962 | $2,723 | 31.2% |
| Q2 | 196,547 | $48,870 | $7,667 | $4,157 | $3,509 | 15.7% |
| Q3 | 196,547 | $78,254 | $10,173 | $5,598 | $4,574 | 13.0% |
| Q4 | 196,547 | $121,993 | $13,299 | $7,705 | $5,594 | 10.9% |
| Q5 | 196,547 | $301,987 | $26,254 | $15,694 | $10,560 | 8.7% |
| All households | 982,737 | $113,864 | $12,615 | $7,223 | $5,392 | 11.1% |
South Dallas County: House District 109
Cedar Hill, Lancaster, eastern DeSoto, Glenn Heights, Hutchins, Wilmer, Combine, Ferris and Seagoville
House District 109 has 190,307 residents in 63,170 households (U.S. Census Bureau, 2026b). Its median household income of $76,767 is close to the county and state medians, but its income is spread differently. The district’s lowest-income fifth averages $20,342, more than in the county or the state, and its highest-income fifth averages $215,304, well below the county’s $298,112 (U.S. Census Bureau, 2026b). HD109 is a district of working- and middle-income households, with fewer very high incomes at the top.
Households in HD109 bear an estimated $0.74B a year in current Texas state and local taxes, about $11,656 per household and 12.0% of income. For the district’s lowest-income fifth, the estimate is $6,180 a year, 30.0% of income; for its middle fifth, $10,215, or 12.9% (TCPA, 2025b) (U.S. Census Bureau, 2026b). Most HD109 households own their homes (71%, compared with 63% statewide), and on a median home value of $267,400 they report a median property tax bill of $4,345 — above the state median on a home worth less than the typical Texas home (U.S. Census Bureau, 2026b).
Renting looks different in HD109. Of the district’s 18,580 renter households, 52% live in single-family homes or townhomes, compared with 31% statewide and 21% in Dallas County (U.S. Census Bureau, 2025) (U.S. Census Bureau, 2026b). A family renting a house in the district carries about $5,467 a year in property tax inside the rent — the owner’s whole bill at local rates of 2.3% to 2.4% — compared with $2,534 for an apartment renter, or $3,198 at the 20% figure presented to legislators (PTAD, 2026a) (NAA, 2025) (TAA, 2024) (U.S. Census Bureau, 2026b). Because so many of its renters live in houses, the average HD109 renter household pays about $4,002 a year through rent, more than the state or county average, and $74M across all of the district’s renters.
| Income fifth | Households | Mean income | Texas taxes | Direct | Indirect | Share of income |
|---|---|---|---|---|---|---|
| Q1 | 12,634 | $20,606 | $6,180 | $3,230 | $2,950 | 30.0% |
| Q2 | 12,634 | $51,668 | $7,973 | $4,330 | $3,644 | 15.4% |
| Q3 | 12,634 | $78,992 | $10,215 | $5,624 | $4,592 | 12.9% |
| Q4 | 12,634 | $117,910 | $13,070 | $7,535 | $5,534 | 11.1% |
| Q5 | 12,634 | $218,103 | $20,839 | $12,326 | $8,513 | 9.6% |
| All households | 63,170 | $97,456 | $11,656 | $6,609 | $5,046 | 12.0% |
| Area | Renter share | Median home value | Median property tax (owners) | Average property tax per owner | Median gross rent |
|---|---|---|---|---|---|
| Texas | 37% | $283,800 | $4,232 | $5,132 | $1,403 |
| Dallas County | 49% | $303,000 | $4,798 | $6,365 | $1,565 |
| HD109 | 29% | $267,400 | $4,345 | $4,354 | $1,767 |
The People of Texas
Who carries the current tax system
The numbers in this article land on real people. Texas is home to 31,290,831 people (U.S. Census Bureau, 2025). 40.3% are Hispanic or Latino, 37.8% are non-Hispanic White, 12.0% are Black and 6.0% are Asian. One in four Texans (24%) is a child, 14% are 65 or older, and the median Texan is 35.9 years old (U.S. Census Bureau, 2025). Dallas County is younger (median age 34.1) and is 41% Hispanic, 26% non-Hispanic White and 22% Black. House District 109 is a majority-Black district: 51% of its residents are Black, 31% Hispanic and 13% non-Hispanic White (U.S. Census Bureau, 2026b).
Because the current system takes a larger share of income from households with less income (Section 3), its weight falls hardest on the groups whose typical incomes are lowest. The estimates below place each group’s median household income on the statewide burden curve to show what Texas state and local taxes take from a household at that income. They are estimates for a typical household in each group, not a separate study of each group.
Race and Ethnicity
The median Texas household earns $80,757 (2025 dollars), and at that income Texas taxes take about 12.8% — $10,313 a year (U.S. Census Bureau, 2025) (TCPA, 2025b). Median incomes differ widely by the race and ethnicity of the householder: $123,560 for Asian households, $96,114 for non-Hispanic White households, $67,359 for Hispanic households and $62,555 for Black households (U.S. Census Bureau, 2025). At those incomes, Texas taxes take an estimated 14.4% of a typical Black household’s income and 14.0% of a typical Hispanic household’s, compared with 12.1% for non-Hispanic White and 10.8% for Asian households. That is 7.5 and 7.3 weeks of income, against 6.3 and 5.6.
Renting adds to the gap. 59% of Black households and 41% of Hispanic households rent, compared with 29% of non-Hispanic White households (U.S. Census Bureau, 2025), so more of their property tax arrives hidden in the rent (Section 5). Poverty rates follow the same pattern: 18.4% of Black Texans and 17.8% of Hispanic Texans live below the poverty line, compared with 8.3% of non-Hispanic White Texans (U.S. Census Bureau, 2025).
Age
Households headed by someone under 25 have a median income of $44,406, and 87% of them rent; at that income Texas taxes take about 17.9%. Householders 65 and older have a median of $59,503, and the estimate at that income is 14.7%, compared with 12.0% for householders 45 to 64 (U.S. Census Bureau, 2025). The senior estimate is likely high for many older homeowners, because school districts must grant homeowners 65 and older an additional $60,000 residence homestead exemption on top of the $140,000 exemption every homeowner receives (TCPA, 2026b); seniors who rent receive neither.
Families With Children
Family structure produces the widest spread. A married couple with children under 18 has a median family income of $125,794, and Texas taxes take an estimated 10.7%. A single mother raising children has a median of $40,464, and the estimate rises to 19.9% — 10.3 weeks of income every year (U.S. Census Bureau, 2025) (TCPA, 2025b). There are 793,333 such families in Texas (U.S. Census Bureau, 2025).
Dallas County and House District 109
Dallas County follows the statewide pattern. Its median household earns $77,542, and the estimate is 13.1%; Black households there have a median of $59,130 and an estimated 14.7% (U.S. Census Bureau, 2026b). House District 109 is different in one important way: Black households, who head 56% of the district’s homes, have a median income of $77,169, about the same as the district as a whole ($77,765), so their estimated share (13.1%) matches the district’s typical household (U.S. Census Bureau, 2026b). The heaviest load still falls on the district’s lowest-income families: single mothers have a median family income of $55,587, for an estimated 15.1%, and the district’s lowest-income fifth gives up 30.0% of its income (Section 9).
- Texas taxes take the largest share of income from the groups with the lowest typical incomes: single mothers (19.9%), householders under 25 (17.9%), Black households (14.4%) and Hispanic households (14.0%).
- A typical single mother gives up about 10.3 weeks of income to Texas taxes, compared with 5.6 weeks for a married couple with children.
- The groups with the highest tax shares are also the most likely to rent, so much of what they pay is hidden in rent and prices rather than shown on a tax bill.
- In House District 109, Black households’ median income ($77,169) is well above the Dallas County figure for Black households ($59,130), but the district’s single mothers still give up an estimated 15.1% of income, and its lowest-income fifth 30.0%.
| Measure | Texas | Dallas County | House District 109 |
|---|---|---|---|
| Total population | 31,290,831 | 2,621,179 | 190,307 |
| Median age (years) | 35.9 | 34.1 | 35.3 |
| Hispanic or Latino (any race) | 40.3% | 41.3% | 31.0% |
| White, not Hispanic | 37.8% | 26.4% | 13.2% |
| Black or African American, not Hispanic | 12.0% | 22.1% | 50.7% |
| Asian, not Hispanic | 6.0% | 7.0% | 1.4% |
| All other and multiracial, not Hispanic | 3.9% | 3.3% | 3.6% |
| Children under 18 | 24.5% | 25.1% | 27.6% |
| Adults 65 and over | 14.0% | 11.8% | 11.5% |
| Per capita income (2024$) | $41,614 | $42,559 | $32,789 |
| Median household income (2024$) | $79,721 | $76,547 | $76,767 |
| Poverty rate (persons) | 13.4% | 13.9% | 13.1% |
| Category | Group | Households | Median income (2025$) | Est. Texas taxes, share of income | Est. Texas taxes per year | Weeks of income | Renter share |
|---|---|---|---|---|---|---|---|
| All households | All households | 11,449,769 | $80,757 | 12.8% | $10,313 | 6.6 | 38% |
| Race / ethnicity | White, not Hispanic | 5,084,982 | $96,114 | 12.1% | $11,592 | 6.3 | 29% |
| Hispanic or Latino | 3,845,697 | $67,359 | 14.0% | $9,428 | 7.3 | 41% | |
| Black or African American | 1,500,025 | $62,555 | 14.4% | $9,030 | 7.5 | 59% | |
| Asian | 657,365 | $123,560 | 10.8% | $13,383 | 5.6 | 34% | |
| Age of householder | Under 25 | 536,492 | $44,406 | 17.9% | $7,947 | 9.3 | 87% |
| 25 to 44 | 4,308,767 | $86,483 | 12.5% | $10,804 | 6.5 | 51% | |
| 45 to 64 | 3,990,207 | $98,365 | 12.0% | $11,765 | 6.2 | 27% | |
| 65 and over | 2,614,303 | $59,503 | 14.7% | $8,756 | 7.7 | 21% | |
| Family type | Married couple with children under 18 | 2,353,236 | $125,794 | 10.7% | $13,499 | 5.6 | — |
| Married couple, no children under 18 | 3,221,029 | $112,327 | 11.3% | $12,732 | 5.9 | — | |
| Single mother with children under 18 | 793,333 | $40,464 | 19.9% | $8,052 | 10.3 | — | |
| Single father with children under 18 | 268,294 | $60,910 | 14.6% | $8,884 | 7.6 | — |
| Area | Category | Group | Households | Median income (2025$) | Est. Texas taxes, share of income | Est. Texas taxes per year | Weeks of income | Renter share |
|---|---|---|---|---|---|---|---|---|
| Dallas County | All households | All households | 982,737 | $77,542 | 13.1% | $10,130 | 6.8 | 49% |
| Race / ethnicity | White, not Hispanic | 334,201 | $103,606 | 11.7% | $12,148 | 6.1 | 39% | |
| Hispanic or Latino | 306,427 | $69,809 | 13.8% | $9,614 | 7.2 | 48% | ||
| Black or African American | 246,081 | $59,130 | 14.7% | $8,721 | 7.7 | 63% | ||
| Asian | 67,702 | $110,384 | 11.4% | $12,608 | 5.9 | 48% | ||
| Age of householder | Under 25 | 48,544 | $49,930 | 15.6% | $7,784 | 8.1 | 90% | |
| 25 to 44 | 402,212 | $82,242 | 12.7% | $10,431 | 6.6 | 65% | ||
| 45 to 64 | 342,556 | $87,431 | 12.5% | $10,885 | 6.5 | 37% | ||
| 65 and over | 189,425 | $58,968 | 14.8% | $8,706 | 7.7 | 27% | ||
| Family type | Married couple with children under 18 | 177,025 | $108,596 | 11.5% | $12,490 | 6.0 | — | |
| Married couple, no children under 18 | 236,915 | $115,616 | 11.2% | $12,934 | 5.8 | — | ||
| Single mother with children under 18 | 75,776 | $40,145 | 20.1% | $8,054 | 10.4 | — | ||
| Single father with children under 18 | 19,445 | $51,413 | 15.5% | $7,946 | 8.0 | — | ||
| House District 109 | All households | All households | 63,170 | $77,765 | 13.0% | $10,144 | 6.8 | 29% |
| Race / ethnicity | White, not Hispanic | 9,435 | $80,580 | 12.8% | $10,303 | 6.6 | 23% | |
| Hispanic or Latino | 14,800 | $79,822 | 12.9% | $10,262 | 6.7 | 17% | ||
| Black or African American | 35,664 | $77,169 | 13.1% | $10,108 | 6.8 | 36% | ||
| Asian | 967 | $95,793 | 12.1% | $11,568 | 6.3 | 13% | ||
| Age of householder | Under 25 | 1,063 | $50,961 | 15.5% | $7,897 | 8.1 | 60% | |
| 25 to 44 | 22,503 | $77,907 | 13.0% | $10,152 | 6.8 | 40% | ||
| 45 to 64 | 26,752 | $88,236 | 12.4% | $10,954 | 6.5 | 25% | ||
| 65 and over | 12,852 | $61,280 | 14.6% | $8,918 | 7.6 | 18% | ||
| Family type | Married couple with children under 18 | 12,295 | $111,410 | 11.4% | $12,674 | 5.9 | — | |
| Married couple, no children under 18 | 16,447 | $111,769 | 11.4% | $12,696 | 5.9 | — | ||
| Single mother with children under 18 | 6,757 | $55,587 | 15.1% | $8,379 | 7.8 | — | ||
| Single father with children under 18 | 1,656 | $37,175 | 21.6% | $8,019 | 11.2 | — |
Texas Businesses and the Tax System
What businesses pay, and who finally bears it
Most Texas tax checks are written by businesses. Using the Comptroller’s own split between taxes first paid by individual consumers and taxes first paid by businesses (TCPA, 2025b), businesses pay $110.5B of the $192.3B in current Texas taxes — 57% — and households pay $81.8B directly at the register, on their property tax bills and at the vehicle tax office. An independent estimate reaches nearly the same answer: Ernst & Young’s annual study for the Council On State Taxation finds that Texas businesses paid $108.1B of $181.7B in fiscal 2024 state and local taxes, 59.5% of the total, the 5th-highest business share of any state and well above the national 45.8% (Ernst & Young et al., 2025). Texas also has no personal income tax, which in most other states is a large tax paid mainly by individuals (U.S. Census Bureau, 2026a).
The Taxes Businesses Pay
Property tax is the largest business tax. Of the $108.1B Texas businesses paid in fiscal 2024, $43.2B (40%) was property tax on commercial, industrial, mineral, utility and rental property, $31.4B (29%) was sales tax on the equipment, supplies and services businesses buy to operate, and $13.2B (12%) was excise taxes, including taxes on utilities and insurance (Ernst & Young et al., 2025). The franchise (margin) tax, the closest thing Texas has to a business income tax, was $6.9B — 6% of the total, about half the national share that state corporate income taxes carry (Ernst & Young et al., 2025).
Fourteen state taxes are levied directly on businesses alone, and together they raised $23.0B in fiscal 2025, 27% of all state taxes (TCPA, 2025a). Four tax production at the source: the oil production tax ($5.4B), collected on oil at the wellhead, the natural gas production tax ($2.5B), the oil well service tax ($138.5M) and the cement tax ($11.4M). Nine tax gross receipts, premiums or margins: the franchise tax ($7.1B), the insurance premium and maintenance taxes ($4.5B), the utility gross receipts taxes and assessments, the mixed beverage gross receipts tax, and the taxes on coin-operated machines and combative sports admissions. The fourteenth, the unemployment tax ($2.0B), is levied on employers’ payrolls (TCPA, 2025a).
Businesses also pay the same taxes households pay. They pay 59% of property taxes, 41% of sales and use taxes, 42% of motor vehicle taxes and 44% of motor fuel taxes on the vehicles, fuel and supplies they use (TCPA, 2025b). They also remit the excise taxes on cigarettes, alcohol and motor fuel, which are collected from customers in the price.
Who Finally Bears Business Taxes
A tax a business pays does not stay with the business. It moves forward into prices, backward into wages and the prices paid to suppliers, or onto owners through lower returns, and some of each lands outside Texas (TCPA, 2025b). Of the $110.5B that businesses and visitors pay first, about $60.9B (55%) comes back to Texas households through the prices they pay, the wages they earn and the returns on what they own. The other $49.6B (45%) is borne outside Texas — by out-of-state owners and shareholders, out-of-state buyers of Texas oil, gas and goods, and visitors (TCPA, 2025b). The export is largest for the oil and gas production taxes: 64% is borne outside Texas, compared with 37% of the franchise tax and 29% of property taxes (TCPA, 2025b).
Small and Large Businesses
The Comptroller does not divide taxes by business size, but it does divide them by legal form. Corporations pay 82% of the business-paid franchise tax, 83% of the insurance premium tax, 68% of the business share of school property tax and 72% of the business share of sales tax; partnerships and sole proprietorships, the forms most small firms take, pay the rest (TCPA, 2025b). Texas has 3,517,343 small businesses — 99.8% of all businesses — employing 44.4% of Texas workers, and 3,023,525 of them have no employees (U.S. Small Business Administration [SBA], 2025).
The tax code treats the smallest firms differently. Businesses with total revenue at or below $2.47 million owed no franchise tax for 2024–2025 reports, a threshold that rose to $2.65 million for 2026 (TCPA, 2026a), and sole proprietorships and general partnerships owned by individuals do not owe franchise tax at all (TCPA, n.d.). The property tax exemption for business equipment and other income-producing personal property has since been raised to $125,000 per location, up from $2,500 (PTAD, 2026b) (TCPA, 2025c); that change came after the 2025 tax year measured here. Small businesses still pay sales tax on what they buy to operate and property tax on the buildings they own or, through their rent, the buildings they lease.
- Businesses pay first on 57% of current Texas taxes ($110.5B), one of the highest business shares in the country (59.5% in the EY/COST study, 5th of 50 states).
- Property tax is the largest business tax, and the 14 state taxes levied only on businesses — led by the franchise, oil and gas production and insurance taxes — raise $23.0B a year.
- About 55% of what businesses pay is passed back to Texas households in prices, wages and returns; the rest is borne outside Texas.
- Measured against the size of the economy, Texas business taxes (4.4% of private-sector output) are close to the national average (4.5%) (Ernst & Young et al., 2025).
| Tax family | Total | Paid first by consumers | Paid first by businesses | Business share | Passed to Texas households | Borne outside Texas |
|---|---|---|---|---|---|---|
| Property taxes | $89.4B | $37.1B | $52.3B | 59% | $26.4B | $25.9B |
| Sales and use taxes | $63.6B | $37.2B | $26.4B | 41% | $13.5B | $12.9B |
| Motor vehicle taxes | $7.6B | $4.4B | $3.2B | 42% | $2.6B | $0.6B |
| Motor fuel taxes | $3.9B | $2.2B | $1.7B | 44% | $1.1B | $0.6B |
| Franchise and business taxes | $9.3B | $0.0B | $9.3B | 100% | $5.9B | $3.4B |
| Insurance taxes | $4.5B | $0.0B | $4.5B | 100% | $4.0B | $0.5B |
| Oil and gas production taxes | $8.0B | $0.0B | $8.0B | 100% | $2.8B | $5.2B |
| Tobacco and alcohol taxes | $2.9B | $0.9B | $2.1B | 71% | $2.1B | $0.0B |
| Utility and other taxes | $3.0B | $0.0B | $3.0B | 100% | $2.4B | $0.6B |
| All taxes | $192.3B | $81.8B | $110.5B | 57% | $60.9B | $49.6B |
| Tax | Type | Comptroller object | Collected, FY2025 | Share of state taxes |
|---|---|---|---|---|
| Oil production tax | Production / output | S-3290 | $5.4B | 6.3% |
| Natural gas production tax | Production / output | S-3291 | $2.5B | 2.9% |
| Oil well service tax | Production / output | S-3296 | $138.5M | 0.2% |
| Cement tax | Production / output | S-3136 | $11.4M | 0.0% |
| Franchise (margin) tax | Gross receipts / margins | S-3130,S-3131 | $7.1B | 8.3% |
| Gas, electric and water utility tax | Gross receipts / margins | S-3233 | $569.6M | 0.7% |
| Public utility gross receipts assessment | Gross receipts / margins | S-3230 | $78.1M | 0.1% |
| Gas utility pipeline tax | Gross receipts / margins | S-3234 | $50.9M | 0.1% |
| Insurance premium taxes | Gross receipts / margins | S-3201 | $4.4B | 5.1% |
| Insurance maintenance taxes | Gross receipts / margins | S-3203,S-3214,S-3219,S-3220 | $141.8M | 0.2% |
| Mixed beverage gross receipts tax | Gross receipts / margins | S-3250 | $695.6M | 0.8% |
| Coin-operated amusement machine tax | Gross receipts / margins | S-3150 | $10.7M | 0.0% |
| Combative sports admissions tax | Gross receipts / margins | S-3146 | $1.3M | 0.0% |
| Unemployment tax | Payroll | S-3728,S-3771 | $2.0B | 2.4% |
| All 14 business taxes | $23.0B | 26.9% |
| Tax type | Texas | Share of Texas business taxes | U.S. share |
|---|---|---|---|
| Property taxes | $43.2B | 40.0% | 34.0% |
| Sales taxes on business inputs | $31.4B | 29.0% | 21.4% |
| Excise taxes, incl. public utilities and insurance | $13.2B | 12.2% | 11.6% |
| Franchise (margin) tax | $6.9B | 6.4% | 12.4% |
| Individual income tax on pass-through business income | $0.0B | 0.0% | 8.1% |
| Unemployment insurance tax | $2.2B | 2.0% | 3.5% |
| License and other taxes, incl. severance | $11.2B | 10.4% | 9.0% |
| Total business taxes | $108.1B | 100.0% | 100.0% |
| Tax | Total | Business share of tax | Corporations’ share of business-paid | Partnerships and sole proprietors’ share |
|---|---|---|---|---|
| Limited sales and use tax | $54,836M | 41% | 72% | 28% |
| Franchise tax | $7,671M | 100% | 82% | 18% |
| Motor vehicle sales and use tax | $6,842M | 42% | 70% | 30% |
| Oil production tax | $6,780M | 100% | 69% | 31% |
| School property tax | $43,991M | 59% | 68% | 32% |
| Natural gas production tax | $3,421M | 100% | 66% | 34% |
| Gasoline tax | $2,946M | 24% | 61% | 39% |
| Insurance premium tax | $4,360M | 100% | 83% | 17% |
| Measure | Amount | Share |
|---|---|---|
| Paid first by businesses and visitors | $110.5B | 100% |
| Passed to Texas households (prices, wages, returns) | $60.9B | 55% |
| Borne outside Texas | $49.6B | 45% |
Texas Among the States
How the Texas tax system compares
Measured in total, Texas is a low-tax state. Its state and local governments collected $5,670 in taxes per resident in fiscal 2024, compared with $7,230 across all 50 states, ranking 33rd-highest of 50; and its taxes equaled 8.3% of Texans’ personal income, against 10.1% nationally, 43rd of 50 (U.S. Census Bureau, 2026a) (BEA, 2026a). Texas is one of five states — with Alaska, Florida, Nevada and Wyoming — where the Census Bureau records no individual income tax revenue at all in fiscal 2024 (U.S. Census Bureau, 2026a).
How Texas raises its money is what sets it apart. Property tax supplies 41% of Texas state and local taxes — the 3rd-highest share in the nation, against 29% nationally — and sales and excise taxes supply 51%, the 8th-highest share (U.S. Census Bureau, 2026a). For a homeowner, the typical (median) property tax bill in 2024 of $4,108 equals 1.31% of the home’s value, the 8th-highest rate of any state (U.S. Census Bureau, 2025).
That mix shapes who pays. The Institute on Taxation and Economic Policy ranks Texas’s state and local tax system the 7th most regressive in the country: it estimates that the lowest-income 20% of Texas families pay 12.8% of their income in state and local taxes and the top 1% pay 4.6%, compared with national averages of 11.4% and 7.2% (Institute on Taxation and Economic Policy [ITEP], 2024). ITEP also notes that Texas is one of five states with no income-targeted property tax relief (ITEP, 2024). The Comptroller’s own study, using different methods, points in the same direction for the eight taxes it covers (Section 3) (TCPA, 2025b). The Tax Foundation, which measures how a tax structure affects competitiveness rather than who bears it, ranks Texas 7th overall, driven by its first-place ranking for having no individual income tax, while ranking it 46th of 50 on corporate taxes (the franchise tax), 38th on property taxes and 36th on sales taxes (Tax Foundation, 2025).
For businesses, Texas sits near the middle once the size of its economy is counted. Businesses carry 59.5% of Texas state and local taxes, the 5th-highest share, but their taxes equal 4.4% of private-sector output, 27th of 50 and close to the 4.5% national average; per employee they pay $9.0 thousand, against $8.6 thousand nationally (Ernst & Young et al., 2025).
Living costs in Texas are a little below the national average: prices are 2.9% below the U.S. level, the 24th-highest price level of 50 states, and the median Texas household income of $79,721 ranks 24th-highest (BEA, 2026a) (U.S. Census Bureau, 2025). After adjusting for prices, per-person income ranks 26th-highest (BEA, 2026a). The low total tax level helps, but because so much of it comes through property and sales taxes, the households with the least income give up the largest share of it.
- Texas collects less than most states: $5,670 per resident (33rd) and 8.3% of personal income (43rd).
- It relies more on property tax than all but two states (41% of taxes) and has the 8th-highest homeowner property tax rate.
- Independent studies agree it is among the most regressive systems: ITEP ranks it 7th, with the lowest-income families paying nearly three times the top 1%’s rate.
- Businesses pay one of the largest shares of taxes (5th), though their burden relative to the economy is about average.
| Measure | Texas | United States | Texas rank |
|---|---|---|---|
| State and local taxes per person | $5,670 | $7,230 | 33 of 50 |
| State and local taxes as share of personal income | 8.3% | 10.1% | 43 of 50 |
| Property tax share of all state and local taxes | 40.9% | 29.4% | 3 of 50 |
| Sales and excise tax share of all state and local taxes | 51.3% | 35.2% | 8 of 50 |
| Property tax per person | $2,320 | $2,127 | 15 of 50 |
| Effective homeowner property tax rate (median tax ÷ median value) | 1.31% | — | 8 of 50 |
| Median homeowner real estate tax | $4,108 | — | 12 of 50 |
| Regional price parity (U.S. = 100) | 97.1 | 100.0 | 24 of 50 |
| Median household income | $79,721 | — | 24 of 50 |
| Real per capita personal income (price-adjusted) | $72,313 | — | 26 of 50 |
| Business share of state and local taxes (EY/COST) | 59.5% | 45.8% | 5 of 50 |
| Business taxes as share of private-sector output (EY/COST TEBTR) | 4.4% | 4.5% | 27 of 50 |
| Business taxes per employee, $ thousands (EY/COST) | $9.0K | $8.6K | 14 of 50 |
| Study | Measure | Value | Note |
|---|---|---|---|
| ITEP Who Pays? 7th ed. (2024) | Texas rank, most regressive state and local tax system (1 = most regressive) | 7 | Non-elderly taxpayers; 2024 law at 2023 incomes |
| ITEP Who Pays? 7th ed. (2024) | Texas: lowest 20% of families, state and local taxes as share of income | 12.8% | |
| ITEP Who Pays? 7th ed. (2024) | Texas: middle 20% | 9.9% | |
| ITEP Who Pays? 7th ed. (2024) | Texas: top 1% | 4.6% | |
| ITEP Who Pays? 7th ed. (2024) | U.S. average: lowest 20% | 11.4% | |
| ITEP Who Pays? 7th ed. (2024) | U.S. average: middle 20% | 10.5% | |
| ITEP Who Pays? 7th ed. (2024) | U.S. average: top 1% | 7.2% | |
| Tax Foundation 2026 State Tax Competitiveness Index | Texas overall rank (1 = most competitive) | 7 | Tax structure as of July 1, 2025 |
| Tax Foundation 2026 State Tax Competitiveness Index | Corporate tax rank | 46 | |
| Tax Foundation 2026 State Tax Competitiveness Index | Individual income tax rank | 1 | |
| Tax Foundation 2026 State Tax Competitiveness Index | Sales tax rank | 36 | |
| Tax Foundation 2026 State Tax Competitiveness Index | Property tax rank | 38 | |
| Tax Foundation 2026 State Tax Competitiveness Index | Unemployment insurance tax rank | 31 |
Which Level of Government Taxes Texans Most
The state, counties, cities, school districts and special districts compared
Texans pay taxes to five tiers of government: the State of Texas; 254 counties; more than 1,100 cities and about 1,200 school districts that levied a property tax in 2025; and more than 2,300 property-taxing special districts that run hospitals, community colleges, water and utility systems, emergency services, flood control and ports, along with the transit authorities and special purpose districts that levy sales tax (PTAD, 2026a) (TCPA, 2026c). Each tier levies its own taxes, and each is counted here with the same incidence method used throughout this article (TCPA, 2025a) (PTAD, 2026a) (TCPA, 2026c) (U.S. Census Bureau, 2026a) (TCPA, 2025b).
The State is the largest single tier. It collects $85.6B, 44% of all current Texas taxes, almost entirely from sales, motor vehicle, fuel, franchise, production and insurance taxes, and it costs the average Texas household about $5,700 a year. But local governments together collect more: $106.8B, 56% of the total, about $6,763 per household. Among them, school districts are by far the largest. Their property taxes raise $41.7B (22%), more than counties and special districts combined, and cost the average household about $2,585 a year. Cities follow with $28.2B, including $9.1B in local sales tax; special districts raise $18.7B, including $4.5B in transit and special purpose district sales taxes; and counties raise $18.2B (PTAD, 2026a) (TCPA, 2026c) (U.S. Census Bureau, 2026a).
Every tier takes a larger share of income from lower-income households than from higher-income households. For the lowest-income fifth, state taxes take 15.1% of income and school district taxes 6.3%; for the highest-income fifth, they take 3.7% and 2.0% (TCPA, 2025b). The State’s reliance on sales and excise taxes and the local tiers’ reliance on property tax both land hardest on households with less income. Renters carry these local taxes too: the average renter household bears $2,740 a year in school district taxes, compared with $2,492 for the average homeowner household, reflecting that rental homes receive no homestead exemption and their tax is passed through in rent (Section 5).
Texas Businesses, Tier by Tier
Businesses pay first on about the same share of every tier’s taxes, from 54% to 59%. In dollars, the State takes the most from businesses — $49.5B, through the franchise, production, insurance and utility taxes and the sales tax on business purchases — followed by school districts at $24.4B in property tax on commercial, industrial, mineral, utility and rental property. Local governments together take $61.0B from businesses first, more than the State (TCPA, 2025b) (PTAD, 2026a). As Section 11 shows, a little more than half of what businesses pay is passed back to Texas households.
Dallas County and House District 109
In Dallas County, local governments levied $9.5B in property taxes for 2025. School districts levied $4.2B (44%), cities $2.9B (30%), special districts — chiefly the Parkland hospital district and Dallas College — $1.5B (16%), and Dallas County itself $1.0B (10%) (PTAD, 2026a). On a home in House District 109 with no exemptions, the school district accounts for about half of the combined property tax rate: 49% in Cedar Hill, 50% in DeSoto and 52% in Lancaster. The city takes roughly a quarter, Parkland and Dallas College about 14% and the county about 9% (PTAD, 2026a).
- The State is the largest single taxing tier (44% of all Texas taxes, about $5,700 per household), but local governments together collect more (56%).
- School districts are the largest local tier: $41.7B a year, about $2,585 per household, more than counties and special districts combined.
- Every tier takes the largest share of income from the lowest-income households, and renters bear local property taxes through their rent.
- In House District 109, the school district accounts for about half of a home’s property tax rate, the city about a quarter.
| Tier | Collected | Share of all taxes | Borne by Texas households | Per household | Per homeowner household | Per renter household | Borne outside Texas |
|---|---|---|---|---|---|---|---|
| The State of Texas | $85.6B | 44% | $65.3B | $5,700 | $5,874 | $5,412 | $20.3B |
| Counties | $18.2B | 9% | $13.1B | $1,146 | $1,109 | $1,206 | $5.1B |
| Cities | $28.2B | 15% | $21.0B | $1,835 | $1,819 | $1,861 | $7.2B |
| School districts | $41.7B | 22% | $29.6B | $2,585 | $2,492 | $2,740 | $12.1B |
| Special districts | $18.7B | 10% | $13.7B | $1,197 | $1,173 | $1,237 | $5.0B |
| All tiers | $192.3B | 100% | $142.7B | $12,463 | $12,467 | $12,456 | $49.6B |
| Tier | Property taxes | Sales and use taxes | All other taxes | Total |
|---|---|---|---|---|
| The State of Texas | $0.0B | $49.2B | $36.4B | $85.6B |
| Counties | $16.8B | $0.9B | $0.5B | $18.2B |
| Cities | $16.7B | $9.1B | $2.4B | $28.2B |
| School districts | $41.7B | $0.0B | $0.0B | $41.7B |
| Special districts | $14.3B | $4.5B | $0.0B | $18.7B |
| All tiers | $89.4B | $63.6B | $39.3B | $192.3B |
| Tier | Lowest fifth | Second fifth | Middle fifth | Fourth fifth | Highest fifth |
|---|---|---|---|---|---|
| The State of Texas | $2,599 (15.1%) | $3,729 (7.7%) | $5,079 (6.3%) | $6,461 (5.0%) | $10,631 (3.7%) |
| Counties | $482 (2.8%) | $653 (1.3%) | $874 (1.1%) | $1,216 (0.9%) | $2,505 (0.9%) |
| Cities | $791 (4.6%) | $1,109 (2.3%) | $1,491 (1.8%) | $1,960 (1.5%) | $3,824 (1.3%) |
| School districts | $1,080 (6.3%) | $1,456 (3.0%) | $1,948 (2.4%) | $2,711 (2.1%) | $5,732 (2.0%) |
| Special districts | $510 (3.0%) | $704 (1.4%) | $945 (1.2%) | $1,269 (1.0%) | $2,558 (0.9%) |
| All tiers | $5,462 (31.7%) | $7,650 (15.7%) | $10,337 (12.7%) | $13,616 (10.6%) | $25,250 (8.7%) |
| Tier | Collected | Paid first by consumers | Paid first by businesses | Business share |
|---|---|---|---|---|
| The State of Texas | $85.6B | $36.0B | $49.5B | 58% |
| Counties | $18.2B | $7.7B | $10.5B | 57% |
| Cities | $28.2B | $12.3B | $15.9B | 57% |
| School districts | $41.7B | $17.3B | $24.4B | 59% |
| Special districts | $18.7B | $8.5B | $10.2B | 54% |
| All tiers | $192.3B | $81.8B | $110.5B | 57% |
| Area | County | City | School district | Special districts | Total |
|---|---|---|---|---|---|
| Dallas County levies, TY2025 | $1.0B | $2.9B | $4.2B | $1.5B | $9.5B |
| Texas average (inside a city) (rate per $100) | 0.3487 | 0.5316 | 1.0136 | 0.2963 | 2.1903 |
| Dallas / Dallas ISD (rate per $100) | 0.2155 | 0.6988 | 0.9938 | 0.3186 | 2.2267 |
| Cedar Hill / Cedar Hill ISD (rate per $100) | 0.2155 | 0.6364 | 1.1279 | 0.3186 | 2.2984 |
| DeSoto / DeSoto ISD (rate per $100) | 0.2155 | 0.6849 | 1.2252 | 0.3186 | 2.4442 |
| Lancaster / Lancaster ISD (rate per $100) | 0.2155 | 0.5995 | 1.2244 | 0.3186 | 2.3580 |
Conclusion
What the current system means for Texans
Counted in full, the current Texas tax system collects $192.3B a year from 70 state and local tax sources. Texas households bear $142.7B of it, about $12,463 for the average household, and most of what they pay never appears on a tax bill: it is built into the price of what they buy, the rent they pay and the wages they earn. Businesses write the majority of the checks, but more than half of what they pay comes back to Texas households.
By national standards Texas collects less than most states. But it raises that money mainly from property and sales taxes, which take a larger share of income from households with less of it. The lowest-income fifth of Texas households gives up 31.7% of its income to Texas taxes, more than three times the 8.7% given up by the highest-income fifth. Renters bear about as much as homeowners on half the income; families renting houses carry the owner’s entire property tax bill in their rent; and single mothers, Black and Hispanic households and young householders, whose typical incomes are lowest, carry the largest shares. In South Dallas County’s House District 109, the district’s lowest-income households give up 30.0% of their income.
Every level of government contributes to that pattern. The State collects the most of any single tier, mainly through sales and excise taxes, but counties, cities, school districts and special districts together collect more, mainly through property taxes; school districts alone cost the average household about $2,585 a year. In House District 109, the school district sets about half of a home’s property tax rate.
These are the facts of the system as it stands today. They are the baseline against which any change to how Texas taxes its people and its businesses should be measured.
Reading the Data
What these numbers can and cannot tell us
- The incidence shares are official, but forecast. They come from the Comptroller’s January 2025 study, which reports fiscal 2027 distributions under the law in place at the time (TCPA, 2025b). The next edition is expected for the 90th Legislature.
- Direct and indirect are separated; the hidden channels are not. Published data do not split the indirect amount among prices, rent, wages and investment returns by income group.
- Survey years differ. Taxes are FY2025 and TY2025; households and incomes are 2024; spending patterns are 2022–2023 adjusted for prices. The Census Bureau and BLS are scheduled to release 2025 household and national spending data on October 29, 2026, and this baseline will be refreshed when they do.
- Quintiles are approximate across sources. The Comptroller, the Census Bureau and BLS each divide Texas households into equal fifths, but each uses its own income definition. Section 3 shows the result both ways: Census income gives 31.7% for the lowest fifth and 8.7% for the highest; the Comptroller’s broader income gives about 24% and 6%.
- Rent figures are measured for apartments and calculated for houses. The apartment share of rent comes from operating statements and varies by market, property type and year (about 14% to 20% in Texas data for 2023–2025). For houses and townhomes it is calculated from 2025 tax rates and home values; because the value of rented homes is not published, owner-occupied values bound a range, and appraisal limits can keep a rental’s taxable value below market.
- Local figures are estimates. Dallas County and HD109 burdens apply the statewide burden at each income level to local income groups; no official study traces taxes for a county or district. Owner-reported property taxes are actual local data.
- Hotel taxes are excluded. About $2.6B in state and local hotel occupancy taxes is left out (the local amount is the Census Bureau’s local “other selective sales taxes,” which in Texas is mostly hotel occupancy tax) because much of it is paid by out-of-state visitors and business travel rather than Texas households, and no authoritative source divides it among visitors, businesses and Texans (Office of the Governor, 2025).
- Group estimates use the statewide curve. Section 10 places each group’s median income on the statewide burden curve. It shows what Texas taxes take at that income, not differences in how each group spends, rents or qualifies for exemptions.
- Business and state comparisons use other sources. Section 11 pairs the Comptroller’s first-payer shares with an independent business-sponsored estimate (EY/COST) on a different fiscal-year basis. Section 12 uses fiscal 2024 Census tax data for all states, which differs slightly from the fiscal 2025 Texas inventory used elsewhere, and reports ITEP and Tax Foundation rankings as published; the two organizations measure different things.
- Tiers combine sources. Section 13 assigns each tax to the tier that levies it. A small set of Census local tax lines is split among counties, cities and special districts using each government type’s share in Census unit-level data. School districts also receive state aid paid from state taxes; this comparison counts taxes each tier levies, not what each tier spends. Dallas County and House District 109 figures cover property tax only.
Every figure in this article can be rebuilt from public data. The companion workbook contains each source table, every formula and a methods sheet; the original files are available here:
- State taxes. Comptroller, State of Texas 2025 Annual Cash Report, Table 12 (all funds, by revenue object): https://comptroller.texas.gov/transparency/reports/cash-report/2025/96-368.pdf (TCPA, 2025a).
- Property taxes. Comptroller Property Tax Assistance Division, 2025 tax rates and levies for counties, cities, school districts and special districts: https://comptroller.texas.gov/taxes/property-tax/rates/ (PTAD, 2026a).
- Local sales taxes. Texas Open Data sales tax allocations, payments in calendar 2025: https://data.texas.gov/dataset/vfba-b57j (cities) and https://data.texas.gov/dataset/qsh8-tby8 (counties, transit authorities and special purpose districts) (TCPA, 2026c).
- Other local taxes. Census 2024 state and local government finance individual unit files: https://www.census.gov/data/datasets/2024/econ/local/public-use-datasets.html (U.S. Census Bureau, 2026a).
- Who bears each tax. Comptroller, Tax Exemptions & Tax Incidence (Publication 96-463), the eight “Initial Distribution and Final Incidence” tables: https://comptroller.texas.gov/transparency/reports/tax-exemptions-and-incidence/ (TCPA, 2025b).
- Households and income. Census American Community Survey 2024 tables B11001, B19081 and B25003, for example https://data.census.gov/table/ACSDT1Y2024.B19081?g=040XX00US48 (U.S. Census Bureau, 2025).
The four steps. (1) Add up every tax line. (2) Multiply each line by the Comptroller’s shares for the five income groups, homeowners and renters, and the amount exported. (3) Divide each income group’s total by its number of households (one-fifth of Texas households). (4) Divide by the group’s mean income. Readers who follow these steps with the same files will arrive at the same results.
Inspect the Data
Explore the underlying data this article is built on — one tab per dataset. Each tab includes the source data table and an expander article explaining how it was produced.
| Measure | Q1 | Q2 | Q3 | Q4 | Q5 | All |
|---|---|---|---|---|---|---|
| Households in quintile | 2,289,954 | 2,289,954 | 2,289,954 | 2,289,954 | 2,289,954 | 11,449,769 |
| Mean household income (2025 dollars) | $17,223 | $48,725 | $81,206 | $128,146 | $290,434 | $113,147 |
| Total Texas taxes per household | $5,462 | $7,650 | $10,337 | $13,616 | $25,250 | $12,463 |
| Direct (visible) per household | $2,842 | $4,148 | $5,697 | $7,947 | $15,094 | $7,146 |
| Indirect (passed-through) per household | $2,620 | $3,502 | $4,640 | $5,669 | $10,156 | $5,317 |
| Taxes as share of household income | 31.7% | 15.7% | 12.7% | 10.6% | 8.7% | 11.0% |
| Indirect share of burden | 48.0% | 45.8% | 44.9% | 41.6% | 40.2% | 42.7% |
| Monthly Texas taxes per household | $455 | $638 | $861 | $1,135 | $2,104 | $1,039 |
| Weeks of income to pay Texas taxes | 16.5 | 8.2 | 6.6 | 5.5 | 4.5 | 5.7 |
| BLS spending per CU (2025 dollars) | $37,045 | $51,419 | $59,627 | $82,879 | $140,351 | $75,328 |
| Taxes as share of spending (cross-check) | 14.7% | 14.9% | 17.3% | 16.4% | 18.0% | 16.5% |
| Comptroller-published burden, 8 taxes (FY2027) | 16.0% | 9.2% | 7.7% | 6.1% | 4.0% | — |
| ID | Tax | Level | Amount | Distribution | Direct share | Borne by TX households | Exported |
|---|---|---|---|---|---|---|---|
| S-3290 | Oil Production Tax | State | $5,384M | OIL | 0.0% | $1,941M | $3,442M |
| S-3291 | Natural Gas Production Tax | State | $2,479M | GAS | 0.0% | $857M | $1,622M |
| S-3234 | Gas Utility Pipeline Tax | State | $51M | SALES | 0.0% | $41M | $10M |
| S-3136 | Cement Tax | State | $11M | SALES | 0.0% | $9M | $2M |
| S-3230 | Public Utility Gross Receipts Assessments | State | $78M | SALES | 0.0% | $62M | $16M |
| S-3233 | Gas, Electric and Water Utility Tax | State | $570M | SALES | 0.0% | $454M | $115M |
| S-3146 | Combative Sports Admissions Tax | State | $1M | SALES | 0.0% | $1M | $0M |
| S-3296 | Oil Well Service Tax | State | $138M | OIL | 0.0% | $50M | $89M |
| S-3004 | Motor Vehicle Sales and Use Tax | State | $6,446M | MVST | 57.9% | $5,988M | $457M |
| S-3005 | Motor Vehicle Rental Tax | State | $455M | SALES | 58.6% | $363M | $92M |
| S-3016 | Motor Vehicle Sales and Use Tax – Seller Financed Motor Vehicles | State | $170M | MVST | 57.9% | $158M | $12M |
| S-3104 | Manufactured Housing Sales and Use Tax | State | $45M | MVST | 57.9% | $42M | $3M |
| S-3275 | Cigarette Tax | State | $850M | TOB | 0.0% | $850M | $0M |
| S-3278 | Cigar and Tobacco Products Tax | State | $261M | TOB | 0.0% | $261M | $0M |
| S-3250 | Mixed Beverage Gross Receipts Tax | State | $696M | ALC | 0.0% | $696M | $0M |
| S-3251 | Mixed Beverage Sales Tax | State | $853M | ALC | 100.0% | $853M | $0M |
| S-3253 | Liquor Tax | State | $123M | ALC | 0.0% | $123M | $0M |
| S-3258 | Malt Beverage Tax | State | $119M | ALC | 0.0% | $119M | $0M |
| S-3259 | Wine Tax | State | $18M | ALC | 0.0% | $18M | $0M |
| S-3008 | Diesel Fuel Tax | State | $1,031M | SALES | 0.0% | $822M | $209M |
| S-3011 | Liquefied and Compressed Natural Gas Tax | State | $7M | SALES | 0.0% | $6M | $1M |
| S-3007 | Gasoline Tax | State | $2,880M | GASOLINE | 75.8% | $2,456M | $423M |
| S-3130 | Franchise/Business Margins Tax | State | $7,081M | FRAN | 0.0% | $4,466M | $2,615M |
| S-3131 | Franchise Tax | State | $-0M | FRAN | 0.0% | $-0M | $-0M |
| S-3201 | Insurance Premium Taxes | State | $4,367M | INS | 0.0% | $3,907M | $459M |
| S-3203 | Insurance Maintenance Taxes | State | $100M | INS | 0.0% | $90M | $11M |
| S-3214 | Insurance Maintenance Tax/Fee Collections – Comptroller | State | $-17M | INS | 0.0% | $-16M | $-2M |
| S-3219 | Insurance Maintenance Tax – Workers’ Compensation Division and Office of Injured Employee Counsel | State | $58M | INS | 0.0% | $52M | $6M |
| S-3220 | Insurance Maintenance Tax -Workers’ Compensation Research and Oversight Division | State | $1M | INS | 0.0% | $1M | $0M |
| S-3584 | Controlled Substance Tax Certificates Billing | State | $0M | SALES | 0.0% | $0M | $0M |
| S-3150 | Coin-Operated Amusement Machine Tax | State | $11M | SALES | 0.0% | $9M | $2M |
| S-3728 | Unemployment Assessments | State | $2,026M | FRAN | 0.0% | $1,278M | $748M |
| S-3771 | Tax Refunds to Employers of TANF Recipients | State | $-0M | FRAN | 0.0% | $-0M | $-0M |
| S-3010 | Motor Fuel Lube Sales Tax | State | $40M | SALES | 58.6% | $32M | $8M |
| S-3100 | Interest on Retail Credit Sale | State | $0M | SALES | 58.6% | $0M | $0M |
| S-3101 | Prepay Limited Sales and Use Tax | State | $14,770M | SALES | 58.6% | $11,782M | $2,989M |
| S-3102 | Limited Sales and Use Tax | State | $34,345M | SALES | 58.6% | $27,395M | $6,950M |
| S-3103 | Limited Mixed Sales and Use Tax-State | State | $15M | SALES | 58.6% | $12M | $3M |
| S-3105 | Discount for Sales Tax – State Agencies and Higher Education | State | $0M | SALES | 58.6% | $0M | $0M |
| S-3111 | Boat and Boat Motor Sales and Use Tax | State | $91M | MVST | 57.9% | $84M | $6M |
| S-3127 | Fireworks Tax | State | $0M | SALES | 0.0% | $0M | $0M |
| LPT-01 | Property tax (M&O + I&S; general, road & bridge, FMFC) | County | $16,791M | SCHOOLPT | 41.5% | $11,933M | $4,858M |
| LPT-02 | Property tax (M&O + I&S) | City | $16,734M | SCHOOLPT | 41.5% | $11,892M | $4,842M |
| LPT-03 | Property tax (M&O + I&S) | School district | $41,655M | SCHOOLPT | 41.5% | $29,602M | $12,052M |
| LPT-SD01 | Property tax — Hospital / health / medical districts | Special district | $4,895M | SCHOOLPT | 41.5% | $3,479M | $1,416M |
| LPT-SD02 | Property tax — Junior / community college & higher-ed districts | Special district | $3,559M | SCHOOLPT | 41.5% | $2,529M | $1,030M |
| LPT-SD03 | Property tax — Municipal utility districts (MUD) | Special district | $2,325M | SCHOOLPT | 41.5% | $1,652M | $673M |
| LPT-SD04 | Property tax — Emergency services / fire districts (ESD, RFPD) | Special district | $1,221M | SCHOOLPT | 41.5% | $868M | $353M |
| LPT-SD05 | Property tax — Water control & improvement / fresh water / utility / reclamation districts | Special district | $752M | SCHOOLPT | 41.5% | $535M | $218M |
| LPT-SD06 | Property tax — Drainage / levee / flood control / watershed districts | Special district | $659M | SCHOOLPT | 41.5% | $468M | $191M |
| LPT-SD07 | Property tax — Other special districts | Special district | $436M | SCHOOLPT | 41.5% | $310M | $126M |
| LPT-SD08 | Property tax — Road / management / development / improvement districts (MMD, PID, SID, TIRZ-type) | Special district | $145M | SCHOOLPT | 41.5% | $103M | $42M |
| LPT-SD09 | Property tax — Navigation / port districts | Special district | $124M | SCHOOLPT | 41.5% | $88M | $36M |
| LPT-SD10 | Property tax — River / soil & water / other authorities | Special district | $84M | SCHOOLPT | 41.5% | $60M | $24M |
| LPT-SD11 | Property tax — Groundwater / underground water conservation districts | Special district | $34M | SCHOOLPT | 41.5% | $24M | $10M |
| LPT-SD12 | Property tax — School equalization districts | Special district | $18M | SCHOOLPT | 41.5% | $13M | $5M |
| LPT-SD13 | Property tax — Public utility districts (PUD) | Special district | $14M | SCHOOLPT | 41.5% | $10M | $4M |
| LST-01 | Local sales and use tax (general, property-tax relief, economic development 4A/4B, street maintenance, venue) | City | $9,067M | SALES | 58.6% | $7,232M | $1,835M |
| LST-02 | Local sales and use tax (general, health services, venue) | County | $888M | SALES | 58.6% | $708M | $180M |
| LST-03 | Metropolitan transit authority / city transit department sales and use tax | Transit authority | $3,010M | SALES | 58.6% | $2,401M | $609M |
| LST-04 | SPD sales and use tax (crime control, hospital, emergency services, library, development districts, etc.) | Special purpose district | $1,451M | SALES | 58.6% | $1,157M | $294M |
| LOT-02 | Local public utility taxes (gross-receipts / right-of-way charges on utilities, as classified by Census) | Local (all types) | $1,421M | SALES | 0.0% | $1,133M | $288M |
| LOT-03 | Local motor vehicle license taxes (county vehicle registration fees) | Local (all types) | $440M | MVST | 57.9% | $408M | $31M |
| LOT-04 | Local occupation and business license taxes | Local (all types) | $174M | FRAN | 0.0% | $110M | $64M |
| LOT-05 | Other local license taxes | Local (all types) | $826M | SALES | 0.0% | $659M | $167M |
| LOT-06 | Local alcoholic beverage license taxes | Local (all types) | $14M | ALC | 0.0% | $14M | $0M |
| LOT-07 | Local amusement taxes | Local (all types) | $11M | SALES | 0.0% | $9M | $2M |
| LOT-08 | Local amusement license taxes | Local (all types) | $3M | SALES | 0.0% | $2M | $1M |
| LOT-09 | Local public utility license taxes | Local (all types) | $0M | SALES | 0.0% | $0M | $0M |
| LOT-10 | Local taxes not elsewhere classified | Local (all types) | $46M | SALES | 0.0% | $37M | $9M |
| Total | $192,348M | $142,699M | $49,649M |
| Distribution | Q1 | Q2 | Q3 | Q4 | Q5 | Exported | Homeowners | Renters |
|---|---|---|---|---|---|---|---|---|
| SALES | 7.2% | 10.5% | 14.2% | 17.4% | 30.4% | 20.2% | 51.0% | 28.8% |
| MVST | 8.3% | 11.0% | 14.5% | 25.4% | 33.6% | 7.1% | 56.7% | 36.2% |
| FRAN | 4.0% | 7.0% | 11.0% | 14.6% | 26.5% | 36.9% | 45.7% | 17.4% |
| OIL | 2.0% | 3.0% | 5.0% | 9.1% | 16.9% | 63.9% | 24.0% | 12.0% |
| GAS | 2.9% | 5.1% | 5.8% | 7.5% | 13.2% | 65.4% | 16.5% | 18.1% |
| GASOLINE | 10.1% | 13.7% | 19.1% | 20.1% | 22.1% | 14.7% | 53.9% | 31.4% |
| INS | 11.3% | 12.1% | 18.6% | 22.1% | 25.5% | 10.5% | 55.3% | 34.1% |
| SCHOOLPT | 5.9% | 8.0% | 10.7% | 14.9% | 31.5% | 28.9% | 42.7% | 28.4% |
| TOB | 23.6% | 26.0% | 21.9% | 12.7% | 15.9% | 0.0% | 59.2% | 40.8% |
| ALC | 5.6% | 12.5% | 16.9% | 21.4% | 43.6% | 0.0% | 71.4% | 28.6% |
| Category | All (2022–23) | Q1 (2025$) | Q2 (2025$) | Q3 (2025$) | Q4 (2025$) | Q5 (2025$) | All (2025$) |
|---|---|---|---|---|---|---|---|
| Total spending | $69,802 | $37,045 | $51,419 | $59,627 | $82,879 | $140,351 | $75,328 |
| Groceries | $4,721 | $3,051 | $3,455 | $4,442 | $5,699 | $7,751 | $4,914 |
| Restaurants and takeout | $3,852 | $2,014 | $2,410 | $3,533 | $4,386 | $9,358 | $4,380 |
| Housing (all) | $23,133 | $15,774 | $19,213 | $20,550 | $26,813 | $41,097 | $24,965 |
| Rent | $5,255 | $6,133 | $6,790 | $5,560 | $6,215 | $4,363 | $5,791 |
| Owned home costs | $7,458 | $3,586 | $4,449 | $6,008 | $8,597 | $18,293 | $8,357 |
| Utilities and phone | $4,847 | $3,753 | $4,573 | $5,395 | $6,052 | $7,423 | $5,483 |
| Transportation (all) | $13,384 | $7,955 | $7,210 | $12,795 | $16,662 | $26,450 | $14,444 |
| Vehicle purchases | $5,736 | $3,511 | $1,473 | $4,710 | $6,670 | $12,984 | $5,990 |
| Gasoline | $3,070 | $1,573 | $1,999 | $2,676 | $3,005 | $3,539 | $2,583 |
| Health care | $5,265 | $2,922 | $4,335 | $4,408 | $6,254 | $8,947 | $5,443 |
| Entertainment | $3,184 | $1,195 | $1,977 | $1,909 | $3,311 | $8,207 | $3,377 |
| Apparel | $1,667 | $832 | $877 | $1,515 | $1,632 | $3,734 | $1,734 |
| Education | $873 | $235 | $194 | $644 | $900 | $2,257 | $869 |
| Personal insurance and pensions | $8,021 | $676 | $2,520 | $5,603 | $11,137 | $22,060 | $8,656 |
| Income before taxes (survey) | $91,099 | $14,344 | $37,834 | $65,534 | $111,789 | $248,382 | $98,312 |
| Category | All | Q1 | Q2 | Q3 | Q4 | Q5 |
|---|---|---|---|---|---|---|
| TLES-1 Groceries | $4,914 | $3,051 | $3,455 | $4,442 | $5,699 | $7,751 |
| TLES-2 Residential rent | $5,791 | $6,133 | $6,790 | $5,560 | $6,215 | $4,363 |
| TLES-3 Home utilities | $3,750 | $2,700 | $3,125 | $3,740 | $3,913 | $5,129 |
| TLES-4 Prescription drugs (BLS line incl. OTC) | $504 | $416 | $427 | $476 | $470 | $723 |
| TLES-5 Medical care | $1,208 | $621 | $876 | $833 | $1,445 | $2,168 |
| TLES-6 Education services | $869 | $235 | $194 | $644 | $900 | $2,257 |
| TLES-7 Motor fuel (personal) | $2,588 | $1,576 | $2,005 | $2,681 | $3,017 | $3,543 |
| TLES-8 Childcare (BLS personal services) | $342 | $102 | $136 | $112 | $571 | $748 |
| TLES-9 Primary-residence home purchase | n/a | n/a | n/a | n/a | n/a | n/a |
| TLES-10 Residential property insurance (inside this combined line) | n/a | n/a | n/a | n/a | n/a | n/a |
| TLES-11 Personal auto insurance | $2,059 | $1,024 | $1,535 | $1,993 | $2,476 | $3,138 |
| TLES-12 Individual life insurance | $394 | $141 | $220 | $361 | $449 | $764 |
| TLES-13 Personal vehicle (all vehicles, net outlay) | $5,990 | $3,511 | $1,473 | $4,710 | $6,670 | $12,984 |
| Total, measured TLES lines | $28,410 | $19,510 | $20,235 | $25,552 | $31,826 | $43,567 |
| Average annual expenditures (all) | $75,328 | $37,045 | $51,419 | $59,627 | $82,879 | $140,351 |
| TLES lines as share of spending | 38% | 53% | 39% | 43% | 38% | 31% |
| Item | 1A0C | 1A1C | 1A2C | 1A3C | 2A1W0C | 2A1W1C | 2A1W2C | 2A1W3C | 2A2W0C | 2A2W1C | 2A2W2C | 2A2W3C |
|---|---|---|---|---|---|---|---|---|---|---|---|---|
| Living Wage | $21.77 | $35.77 | $44.95 | $56.14 | $29.34 | $35.06 | $37.39 | $43.35 | $14.67 | $20.44 | $24.45 | $29.51 |
| Poverty Wage | $7.67 | $10.40 | $13.13 | $15.87 | $10.40 | $13.13 | $15.87 | $18.60 | $5.20 | $6.57 | $7.93 | $9.30 |
| Minimum Wage | $7.25 | $7.25 | $7.25 | $7.25 | $7.25 | $7.25 | $7.25 | $7.25 | $7.25 | $7.25 | $7.25 | $7.25 |
| Food | $3,888 | $5,703 | $8,545 | $11,373 | $7,128 | $8,846 | $11,378 | $13,882 | $7,128 | $8,846 | $11,378 | $13,882 |
| Child Care | $0 | $9,724 | $19,178 | $26,128 | $0 | $0 | $0 | $0 | $0 | $9,724 | $19,178 | $26,128 |
| Medical | $3,100 | $9,066 | $9,214 | $9,375 | $7,427 | $9,993 | $10,293 | $10,629 | $7,427 | $9,993 | $10,293 | $10,629 |
| Housing | $14,679 | $18,418 | $18,418 | $24,030 | $15,452 | $18,418 | $18,418 | $24,030 | $15,452 | $18,418 | $18,418 | $24,030 |
| Transportation | $9,013 | $10,431 | $13,139 | $15,118 | $10,431 | $13,139 | $15,118 | $16,926 | $10,431 | $13,139 | $15,118 | $16,926 |
| Civic | $2,583 | $4,360 | $5,749 | $6,547 | $4,360 | $5,749 | $6,547 | $7,330 | $4,360 | $5,749 | $6,547 | $7,330 |
| Internet & Mobile | $1,512 | $1,512 | $1,512 | $1,512 | $2,086 | $2,086 | $2,086 | $2,086 | $2,086 | $2,086 | $2,086 | $2,086 |
| Other | $4,067 | $7,395 | $8,083 | $8,801 | $7,395 | $8,279 | $8,801 | $9,854 | $7,395 | $8,279 | $8,801 | $9,854 |
| Required annual income after taxes | $38,842 | $66,608 | $83,839 | $102,885 | $54,277 | $66,510 | $72,642 | $84,736 | $54,277 | $76,233 | $91,820 | $110,865 |
| Annual taxes | $6,449 | $7,783 | $9,648 | $13,885 | $6,760 | $6,406 | $5,129 | $5,435 | $6,760 | $8,794 | $9,877 | $11,886 |
| Required annual income before taxes | $45,290 | $74,391 | $93,487 | $116,770 | $61,036 | $72,916 | $77,772 | $90,171 | $61,036 | $85,027 | $101,697 | $122,751 |
| Est. Texas taxes borne (author) | $7,902 | $9,933 | $11,386 | $13,003 | $8,896 | $9,835 | $10,144 | $11,116 | $8,896 | $10,678 | $12,011 | $13,340 |
| Item | 1A0C | 1A1C | 1A2C | 1A3C | 2A1W0C | 2A1W1C | 2A1W2C | 2A1W3C | 2A2W0C | 2A2W1C | 2A2W2C | 2A2W3C |
|---|---|---|---|---|---|---|---|---|---|---|---|---|
| Living Wage | $23.31 | $37.90 | $47.71 | $59.68 | $30.79 | $36.54 | $38.88 | $44.80 | $15.39 | $21.49 | $25.78 | $31.03 |
| Poverty Wage | $7.67 | $10.40 | $13.13 | $15.87 | $10.40 | $13.13 | $15.87 | $18.60 | $5.20 | $6.57 | $7.93 | $9.30 |
| Minimum Wage | $7.25 | $7.25 | $7.25 | $7.25 | $7.25 | $7.25 | $7.25 | $7.25 | $7.25 | $7.25 | $7.25 | $7.25 |
| Food | $4,019 | $5,896 | $8,834 | $11,758 | $7,369 | $9,145 | $11,763 | $14,352 | $7,369 | $9,145 | $11,763 | $14,352 |
| Child Care | $0 | $10,755 | $21,211 | $28,854 | $0 | $0 | $0 | $0 | $0 | $10,755 | $21,211 | $28,854 |
| Medical | $3,032 | $8,759 | $8,906 | $9,068 | $7,214 | $9,686 | $9,986 | $10,322 | $7,214 | $9,686 | $9,986 | $10,322 |
| Housing | $17,805 | $21,732 | $21,732 | $27,360 | $18,547 | $21,732 | $21,732 | $27,360 | $18,547 | $21,732 | $21,732 | $27,360 |
| Transportation | $8,440 | $9,767 | $12,303 | $14,156 | $9,767 | $12,303 | $14,156 | $15,849 | $9,767 | $12,303 | $14,156 | $15,849 |
| Civic | $2,583 | $4,360 | $5,749 | $6,547 | $4,360 | $5,749 | $6,547 | $7,330 | $4,360 | $5,749 | $6,547 | $7,330 |
| Internet & Mobile | $1,454 | $1,454 | $1,454 | $1,454 | $2,027 | $2,027 | $2,027 | $2,027 | $2,027 | $2,027 | $2,027 | $2,027 |
| Other | $4,067 | $7,395 | $8,083 | $8,801 | $7,395 | $8,279 | $8,801 | $9,854 | $7,395 | $8,279 | $8,801 | $9,854 |
| Required annual income after taxes | $41,399 | $70,117 | $88,273 | $107,998 | $56,679 | $68,922 | $75,014 | $87,093 | $56,679 | $79,676 | $96,225 | $115,948 |
| Annual taxes | $7,090 | $8,715 | $10,966 | $16,138 | $7,356 | $7,084 | $5,852 | $6,083 | $7,356 | $9,709 | $11,026 | $13,140 |
| Required annual income before taxes | $48,489 | $78,832 | $99,239 | $124,137 | $64,034 | $76,005 | $80,866 | $93,176 | $64,034 | $89,386 | $107,251 | $129,088 |
| Est. Texas taxes borne (author) | $7,672 | $10,206 | $11,830 | $13,413 | $9,157 | $10,037 | $10,319 | $11,361 | $9,157 | $11,050 | $12,400 | $13,702 |
| Geography | Segment | Year | Property tax per unit | Revenue per unit | Share of rent | NAA published |
|---|---|---|---|---|---|---|
| Texas | All apartments | 2023 | $2,242 | $14,415 | 15.6% | 16 cents |
| Texas | All apartments | 2024 | $2,127 | $14,557 | 14.6% | 15 cents |
| Texas | All apartments | 2025 | $2,111 | $14,621 | 14.4% | 14 cents |
| Texas | Market-rate | 2023 | $2,837 | $16,313 | 17.4% | 17 cents |
| Texas | Market-rate | 2024 | $2,631 | $16,339 | 16.1% | 16 cents |
| Texas | Market-rate | 2025 | $2,617 | $16,493 | 15.9% | 16 cents |
| Texas | Affordable | 2023 | $1,791 | $12,975 | 13.8% | 14 cents |
| Texas | Affordable | 2024 | $1,760 | $13,259 | 13.3% | 13 cents |
| Texas | Affordable | 2025 | $1,746 | $13,272 | 13.2% | 13 cents |
| Texas | Manufactured | 2023 | $669 | $8,023 | 8.3% | 8 cents |
| Texas | Manufactured | 2024 | $686 | $8,726 | 7.9% | 8 cents |
| Texas | Manufactured | 2025 | $765 | $9,036 | 8.5% | 8 cents |
| Dallas metro | All apartments | 2023 | $2,574 | $15,803 | 16.3% | 16 cents |
| Dallas metro | All apartments | 2024 | $2,471 | $15,859 | 15.6% | 16 cents |
| Dallas metro | All apartments | 2025 | $2,515 | $15,867 | 15.9% | 16 cents |
| Dallas metro | Market-rate | 2023 | $3,190 | $17,865 | 17.9% | 18 cents |
| Dallas metro | Market-rate | 2024 | $3,048 | $17,782 | 17.1% | 17 cents |
| Dallas metro | Market-rate | 2025 | $3,063 | $17,697 | 17.3% | 17 cents |
| Dallas metro | Affordable | 2023 | $2,037 | $14,012 | 14.5% | 15 cents |
| Dallas metro | Affordable | 2024 | $2,000 | $14,284 | 14.0% | 14 cents |
| Dallas metro | Affordable | 2025 | $2,067 | $14,370 | 14.4% | 14 cents |
| Houston metro | All apartments | 2023 | $2,177 | $14,317 | 15.2% | 15 cents |
| Houston metro | All apartments | 2024 | $2,131 | $14,577 | 14.6% | 15 cents |
| Houston metro | All apartments | 2025 | $2,085 | $14,919 | 14.0% | 14 cents |
| Houston metro | Market-rate | 2023 | $2,731 | $16,005 | 17.1% | 17 cents |
| Houston metro | Market-rate | 2024 | $2,544 | $16,189 | 15.7% | 16 cents |
| Houston metro | Market-rate | 2025 | $2,523 | $16,708 | 15.1% | 15 cents |
| Houston metro | Affordable | 2023 | $1,761 | $13,048 | 13.5% | 13 cents |
| Houston metro | Affordable | 2024 | $1,798 | $13,278 | 13.5% | 14 cents |
| Houston metro | Affordable | 2025 | $1,722 | $13,435 | 12.8% | 13 cents |
| Austin metro | All apartments | 2023 | $2,861 | $16,282 | 17.6% | 18 cents |
| Austin metro | All apartments | 2024 | $2,631 | $16,108 | 16.3% | 16 cents |
| Austin metro | All apartments | 2025 | $2,665 | $15,639 | 17.0% | 17 cents |
| Austin metro | Market-rate | 2023 | $3,441 | $17,618 | 19.5% | 20 cents |
| Austin metro | Market-rate | 2024 | $3,223 | $17,238 | 18.7% | 19 cents |
| Austin metro | Market-rate | 2025 | $3,292 | $17,272 | 19.1% | 19 cents |
| Austin metro | Affordable | 2023 | $2,448 | $15,330 | 16.0% | 16 cents |
| Austin metro | Affordable | 2024 | $2,285 | $15,446 | 14.8% | 15 cents |
| Austin metro | Affordable | 2025 | $2,336 | $14,779 | 15.8% | 16 cents |
| San Antonio metro | All apartments | 2023 | $2,397 | $13,739 | 17.4% | 17 cents |
| San Antonio metro | All apartments | 2024 | $2,228 | $13,988 | 15.9% | 16 cents |
| San Antonio metro | All apartments | 2025 | $2,074 | $13,645 | 15.2% | 15 cents |
| San Antonio metro | Market-rate | 2023 | $3,002 | $15,395 | 19.5% | 20 cents |
| San Antonio metro | Market-rate | 2024 | $2,790 | $15,772 | 17.7% | 18 cents |
| San Antonio metro | Market-rate | 2025 | $2,639 | $15,201 | 17.4% | 17 cents |
| San Antonio metro | Affordable | 2023 | $1,798 | $12,088 | 14.9% | 15 cents |
| San Antonio metro | Affordable | 2024 | $1,760 | $12,502 | 14.1% | 14 cents |
| San Antonio metro | Affordable | 2025 | $1,616 | $12,386 | 13.0% | 13 cents |
| Nationwide | All apartments | 2023 | $1,840 | $17,595 | 10.5% | 10 cents |
| Nationwide | All apartments | 2024 | $1,840 | $18,081 | 10.2% | 10 cents |
| Nationwide | All apartments | 2025 | $1,909 | $18,556 | 10.3% | 10 cents |
| Nationwide | Market-rate | 2023 | $2,274 | $21,011 | 10.8% | 11 cents |
| Nationwide | Market-rate | 2024 | $2,288 | $21,560 | 10.6% | 11 cents |
| Nationwide | Market-rate | 2025 | $2,371 | $21,987 | 10.8% | 11 cents |
| Nationwide | Affordable | 2023 | $1,436 | $14,426 | 10.0% | 10 cents |
| Nationwide | Affordable | 2024 | $1,440 | $14,972 | 9.6% | 10 cents |
| Nationwide | Affordable | 2025 | $1,480 | $15,381 | 9.6% | 10 cents |
| Fifth | Rent paid (avg. household) | Renter share | Rent per renter household | Property tax in rent, per renter | Property tax passed through, all channels (avg. household) |
|---|---|---|---|---|---|
| Q1 | $6,133 | 55.1% | $11,130 | $2,367 | $1,291 |
| Q2 | $6,790 | 50.5% | $13,445 | $2,859 | $1,329 |
| Q3 | $5,560 | 39.5% | $14,075 | $2,993 | $1,628 |
| Q4 | $6,215 | 29.9% | $20,784 | $4,420 | $2,145 |
| Q5 | $4,363 | 14.0% | $31,166 | $6,628 | $5,157 |
| Area or taxing unit | Type | Rate per $100 |
|---|---|---|
| Texas average | School districts (all ISDs) | 1.0136 |
| Texas average | Counties (all counties) | 0.3487 |
| Texas average | Cities (property inside a city) | 0.5316 |
| Texas average | Special districts (spread over the county base) | 0.2963 |
| Dallas County | County | 0.2155 |
| Dallas County Hospital District (Parkland) | Special district | 0.2120 |
| Dallas College District | Special district | 0.1066 |
| City of Dallas | City | 0.6988 |
| Dallas ISD | School district | 0.9938 |
| City of Cedar Hill | City | 0.6364 |
| Cedar Hill ISD | School district | 1.1279 |
| City of DeSoto | City | 0.6849 |
| DeSoto ISD | School district | 1.2252 |
| City of Lancaster | City | 0.5995 |
| Lancaster ISD | School district | 1.2244 |
| Texas (statewide average, inside a city) | Combined rate | 2.190% |
| Dallas County (City of Dallas / Dallas ISD) | Combined rate | 2.227% |
| HD109: Cedar Hill / Cedar Hill ISD | Combined rate | 2.298% |
| HD109: DeSoto / DeSoto ISD | Combined rate | 2.444% |
| HD109: Lancaster / Lancaster ISD | Combined rate | 2.358% |
| HD109 (average of its three core city/ISD pairs) | Combined rate | 2.367% |
| State | Taxes per person | Rank | Share of personal income | Rank | Property tax share | Rank | Homeowner effective rate | Rank | Price parity (U.S. = 100) | Median household income |
|---|---|---|---|---|---|---|---|---|---|---|
| Alabama | $5,045 | 47 | 9.1% | 34 | 16.8% | 48 | 0.38% | 49 | 88.8 | $66,659 |
| Alaska | $5,798 | 32 | 7.8% | 46 | 42.4% | 2 | 1.06% | 16 | 102.4 | $95,665 |
| Arizona | $5,305 | 44 | 8.3% | 42 | 23.9% | 34 | 0.43% | 47 | 100.7 | $81,486 |
| Arkansas | $5,302 | 45 | 9.2% | 33 | 18.1% | 46 | 0.52% | 39 | 86.9 | $62,106 |
| California | $10,177 | 3 | 12.1% | 7 | 24.5% | 33 | 0.71% | 32 | 110.7 | $100,149 |
| Colorado | $7,086 | 18 | 8.8% | 39 | 33.6% | 15 | 0.49% | 41 | 103.1 | $97,113 |
| Connecticut | $9,797 | 4 | 10.4% | 16 | 34.9% | 10 | 1.66% | 3 | 103.6 | $96,049 |
| Delaware | $7,557 | 15 | 11.8% | 8 | 14.4% | 49 | 0.47% | 43 | 99.8 | $87,534 |
| District of Columbia | $15,111 | — | 13.6% | — | 29.5% | — | 0.63% | — | 109.9 | $109,707 |
| Florida | $5,353 | 43 | 7.4% | 50 | 37.4% | 8 | 0.75% | 26 | 103.4 | $77,735 |
| Georgia | $5,482 | 38 | 9.0% | 35 | 31.6% | 20 | 0.74% | 28 | 96.3 | $79,991 |
| Hawaii | $10,210 | 2 | 14.7% | 2 | 18.9% | 45 | 0.27% | 50 | 110.0 | $100,745 |
| Idaho | $5,481 | 39 | 9.2% | 32 | 19.3% | 42 | 0.43% | 48 | 95.5 | $81,166 |
| Illinois | $9,021 | 8 | 12.2% | 6 | 33.4% | 16 | 1.92% | 1 | 100.0 | $83,211 |
| Indiana | $5,574 | 35 | 9.0% | 36 | 26.7% | 29 | 0.74% | 29 | 93.3 | $71,959 |
| Iowa | $6,404 | 25 | 10.1% | 19 | 32.9% | 18 | 1.29% | 9 | 87.8 | $75,501 |
| Kansas | $6,704 | 23 | 10.4% | 15 | 30.1% | 23 | 1.25% | 10 | 90.1 | $75,514 |
| Kentucky | $5,485 | 37 | 9.7% | 25 | 20.4% | 40 | 0.71% | 30 | 90.2 | $64,526 |
| Louisiana | $6,244 | 27 | 10.4% | 14 | 19.1% | 44 | 0.53% | 38 | 88.2 | $60,986 |
| Maine | $7,741 | 13 | 11.6% | 9 | 39.6% | 6 | 0.91% | 22 | 97.0 | $76,442 |
| Maryland | $8,330 | 11 | 10.8% | 12 | 23.8% | 36 | 0.95% | 21 | 105.0 | $102,905 |
| Massachusetts | $9,421 | 6 | 10.2% | 18 | 34.1% | 12 | 1.00% | 19 | 105.8 | $104,828 |
| Michigan | $5,591 | 34 | 8.9% | 37 | 33.9% | 14 | 1.18% | 13 | 96.2 | $72,389 |
| Minnesota | $8,319 | 12 | 11.3% | 10 | 24.5% | 32 | 1.02% | 17 | 98.6 | $87,117 |
| Mississippi | $4,979 | 49 | 9.8% | 23 | 26.3% | 30 | 0.65% | 34 | 87.0 | $59,127 |
| Missouri | $5,436 | 42 | 8.4% | 41 | 28.8% | 25 | 0.79% | 23 | 90.8 | $71,589 |
| Montana | $5,965 | 31 | 8.9% | 38 | 36.4% | 9 | 0.69% | 33 | 94.6 | $75,340 |
| Nebraska | $7,076 | 19 | 9.9% | 21 | 33.3% | 17 | 1.42% | 7 | 90.1 | $76,376 |
| Nevada | $6,634 | 24 | 9.7% | 24 | 23.8% | 35 | 0.47% | 44 | 100.0 | $81,134 |
| New Hampshire | $6,322 | 26 | 7.7% | 47 | 64.3% | 1 | 1.46% | 4 | 104.2 | $99,782 |
| New Jersey | $9,050 | 7 | 10.9% | 11 | 40.5% | 4 | 1.89% | 2 | 108.8 | $104,294 |
| New Mexico | $8,966 | 9 | 15.8% | 1 | 14.0% | 50 | 0.63% | 35 | 92.2 | $67,816 |
| New York | $12,274 | 1 | 14.6% | 3 | 28.8% | 26 | 1.45% | 5 | 107.9 | $85,820 |
| North Carolina | $5,292 | 46 | 8.4% | 40 | 22.7% | 38 | 0.61% | 36 | 94.3 | $73,958 |
| North Dakota | $9,629 | 5 | 13.3% | 4 | 17.5% | 47 | 0.96% | 20 | 89.0 | $77,871 |
| Ohio | $6,005 | 30 | 9.5% | 27 | 28.1% | 27 | 1.22% | 12 | 92.8 | $72,212 |
| Oklahoma | $4,985 | 48 | 8.1% | 44 | 20.0% | 41 | 0.75% | 27 | 87.8 | $66,148 |
| Oregon | $6,788 | 22 | 9.9% | 20 | 31.0% | 21 | 0.78% | 25 | 103.4 | $85,220 |
| Pennsylvania | $6,905 | 20 | 9.9% | 22 | 26.2% | 31 | 1.16% | 14 | 97.6 | $77,545 |
| Rhode Island | $7,367 | 16 | 10.5% | 13 | 34.3% | 11 | 1.07% | 15 | 102.3 | $83,504 |
| South Carolina | $5,443 | 41 | 9.3% | 30 | 29.0% | 24 | 0.45% | 46 | 93.7 | $72,350 |
| South Dakota | $5,474 | 40 | 7.5% | 49 | 34.0% | 13 | 1.02% | 18 | 88.6 | $76,881 |
| Tennessee | $4,804 | 50 | 7.5% | 48 | 19.2% | 43 | 0.45% | 45 | 91.9 | $71,997 |
| Texas | $5,670 | 33 | 8.3% | 43 | 40.9% | 3 | 1.31% | 8 | 97.1 | $79,721 |
| Utah | $6,112 | 29 | 9.4% | 28 | 23.4% | 37 | 0.49% | 42 | 98.9 | $96,658 |
| Vermont | $8,698 | 10 | 12.4% | 5 | 39.8% | 5 | 1.42% | 6 | 98.0 | $82,730 |
| Virginia | $7,195 | 17 | 9.5% | 26 | 31.9% | 19 | 0.71% | 31 | 101.1 | $92,090 |
| Washington | $7,725 | 14 | 9.3% | 29 | 27.6% | 28 | 0.79% | 24 | 107.0 | $99,389 |
| West Virginia | $5,540 | 36 | 10.3% | 17 | 22.7% | 39 | 0.52% | 40 | 89.5 | $60,798 |
| Wisconsin | $6,142 | 28 | 9.2% | 31 | 31.0% | 22 | 1.25% | 11 | 94.1 | $77,488 |
| Wyoming | $6,853 | 21 | 8.0% | 45 | 38.5% | 7 | 0.57% | 37 | 92.7 | $75,532 |
| State | Business taxes | All state and local taxes | Business share | Rank | Business tax rate (TEBTR) | Rank | Per employee | Rank |
|---|---|---|---|---|---|---|---|---|
| Alabama | $12.7B | $25.9B | 49.2% | 22 | 4.7% | 21 | $7.2K | 36 |
| Alaska | $3.0B | $4.5B | 67.2% | 3 | 5.3% | 12 | $11.9K | 7 |
| Arizona | $17.2B | $40.9B | 42.1% | 36 | 3.5% | 45 | $6.1K | 43 |
| Arkansas | $7.0B | $16.4B | 43.0% | 30 | 4.3% | 32 | $6.1K | 43 |
| California | $174.5B | $407.5B | 42.8% | 33 | 5.0% | 14 | $11.4K | 8 |
| Colorado | $21.3B | $43.7B | 48.8% | 24 | 4.4% | 27 | $8.6K | 18 |
| Connecticut | $11.5B | $36.6B | 31.5% | 50 | 3.6% | 42 | $7.8K | 25 |
| Delaware | $4.6B | $8.1B | 57.5% | 8 | 4.7% | 21 | $11.1K | 9 |
| Florida | $66.6B | $123.2B | 54.1% | 11 | 4.4% | 27 | $7.6K | 30 |
| Georgia | $27.3B | $61.0B | 44.8% | 29 | 3.5% | 45 | $6.4K | 40 |
| Hawaii | $6.3B | $15.1B | 41.6% | 38 | 6.8% | 4 | $12.3K | 6 |
| Idaho | $4.3B | $10.1B | 42.0% | 37 | 3.8% | 40 | $5.8K | 46 |
| Illinois | $56.3B | $113.5B | 49.6% | 19 | 5.5% | 10 | $10.6K | 10 |
| Indiana | $15.5B | $40.9B | 37.8% | 46 | 3.3% | 48 | $5.5K | 48 |
| Iowa | $9.8B | $21.3B | 46.1% | 27 | 4.2% | 35 | $7.4K | 33 |
| Kansas | $9.6B | $19.8B | 48.6% | 25 | 4.8% | 20 | $8.0K | 23 |
| Kentucky | $12.6B | $25.4B | 49.4% | 21 | 4.9% | 18 | $7.3K | 35 |
| Louisiana | $14.1B | $27.9B | 50.6% | 17 | 4.9% | 18 | $8.5K | 19 |
| Maine | $5.4B | $10.6B | 51.2% | 15 | 6.3% | 6 | $9.7K | 12 |
| Maryland | $18.9B | $53.8B | 35.1% | 49 | 4.5% | 25 | $8.3K | 20 |
| Massachusetts | $26.3B | $67.7B | 38.8% | 45 | 3.8% | 40 | $8.1K | 22 |
| Michigan | $20.5B | $57.2B | 35.8% | 48 | 3.3% | 48 | $5.3K | 50 |
| Minnesota | $18.6B | $45.0B | 41.3% | 39 | 4.1% | 36 | $7.2K | 36 |
| Mississippi | $7.8B | $14.9B | 52.1% | 13 | 5.9% | 7 | $8.2K | 21 |
| Missouri | $14.2B | $34.8B | 40.8% | 40 | 3.6% | 42 | $5.6K | 47 |
| Montana | $3.4B | $7.0B | 48.2% | 26 | 5.0% | 14 | $7.8K | 25 |
| Nebraska | $7.6B | $14.3B | 53.2% | 12 | 4.6% | 24 | $8.7K | 16 |
| Nevada | $12.8B | $23.0B | 55.6% | 9 | 5.4% | 11 | $9.2K | 13 |
| New Hampshire | $4.2B | $8.5B | 49.2% | 22 | 3.9% | 39 | $6.8K | 38 |
| New Jersey | $32.8B | $91.1B | 36.0% | 47 | 4.4% | 27 | $8.8K | 15 |
| New Mexico | $11.9B | $18.8B | 63.4% | 4 | 10.6% | 1 | $17.1K | 1 |
| New York | $115.9B | $252.3B | 45.9% | 28 | 5.7% | 8 | $13.8K | 3 |
| North Carolina | $23.4B | $60.2B | 38.9% | 44 | 3.2% | 50 | $5.5K | 48 |
| North Dakota | $5.8B | $7.7B | 75.3% | 1 | 8.1% | 3 | $16.0K | 2 |
| Ohio | $28.7B | $70.6B | 40.7% | 42 | 3.5% | 45 | $5.9K | 45 |
| Oklahoma | $10.9B | $21.2B | 51.5% | 14 | 5.0% | 14 | $7.7K | 29 |
| Oregon | $13.3B | $33.0B | 40.4% | 43 | 4.7% | 21 | $7.9K | 24 |
| Pennsylvania | $40.5B | $94.1B | 43.0% | 30 | 4.5% | 25 | $7.4K | 33 |
| Rhode Island | $3.5B | $8.5B | 40.8% | 40 | 5.1% | 13 | $7.8K | 25 |
| South Carolina | $15.0B | $30.4B | 49.5% | 20 | 5.0% | 14 | $7.6K | 30 |
| South Dakota | $2.9B | $5.0B | 58.3% | 7 | 4.3% | 32 | $7.6K | 30 |
| Tennessee | $19.8B | $36.3B | 54.7% | 10 | 4.0% | 38 | $6.8K | 38 |
| Texas | $108.1B | $181.7B | 59.5% | 5 | 4.4% | 27 | $9.0K | 14 |
| Utah | $9.5B | $22.0B | 43.0% | 30 | 3.6% | 42 | $6.4K | 40 |
| Vermont | $3.4B | $5.8B | 58.6% | 6 | 8.6% | 2 | $13.2K | 5 |
| Virginia | $27.2B | $63.7B | 42.7% | 34 | 4.4% | 27 | $7.8K | 25 |
| Washington | $31.5B | $62.9B | 50.0% | 18 | 4.3% | 32 | $10.4K | 11 |
| West Virginia | $4.9B | $9.7B | 51.0% | 16 | 5.6% | 9 | $8.7K | 16 |
| Wisconsin | $16.3B | $38.7B | 42.2% | 35 | 4.1% | 36 | $6.2K | 42 |
| Wyoming | $3.0B | $4.1B | 72.5% | 2 | 6.8% | 4 | $13.3K | 4 |
| District of Columbia | $5.9B | $10.6B | 56.1% | — | 4.8% | — | $11.1K | — |
| United States | $1,148.1B | $2,506.8B | 45.8% | — | 4.5% | — | $8.6K | — |
| Area | Category | Group | Households | Share of households | Median income (2025$) | Est. share of income | Est. Texas taxes | Weeks | Renter share | Poverty rate |
|---|---|---|---|---|---|---|---|---|---|---|
| Texas | All households | All households | 11,449,769 | 100.0% | $80,757 | 12.8% | $10,313 | 6.6 | 38% | 13.4% |
| Texas | Race / ethnicity of householder | White, not Hispanic | 5,084,982 | 44.4% | $96,114 | 12.1% | $11,592 | 6.3 | 29% | 8.3% |
| Texas | Race / ethnicity of householder | Hispanic or Latino | 3,845,697 | 33.6% | $67,359 | 14.0% | $9,428 | 7.3 | 41% | 17.8% |
| Texas | Race / ethnicity of householder | Black or African American | 1,500,025 | 13.1% | $62,555 | 14.4% | $9,030 | 7.5 | 59% | 18.4% |
| Texas | Race / ethnicity of householder | Asian | 657,365 | 5.7% | $123,560 | 10.8% | $13,383 | 5.6 | 34% | 8.0% |
| Texas | Age of householder | Under 25 | 536,492 | 4.7% | $44,406 | 17.9% | $7,947 | 9.3 | 87% | — |
| Texas | Age of householder | 25 to 44 | 4,308,767 | 37.6% | $86,483 | 12.5% | $10,804 | 6.5 | 51% | — |
| Texas | Age of householder | 45 to 64 | 3,990,207 | 34.8% | $98,365 | 12.0% | $11,765 | 6.2 | 27% | — |
| Texas | Age of householder | 65 and over | 2,614,303 | 22.8% | $59,503 | 14.7% | $8,756 | 7.7 | 21% | — |
| Texas | Family type | Married couple with children under 18 | 2,353,236 | 20.6% | $125,794 | 10.7% | $13,499 | 5.6 | — | — |
| Texas | Family type | Married couple, no children under 18 | 3,221,029 | 28.1% | $112,327 | 11.3% | $12,732 | 5.9 | — | — |
| Texas | Family type | Single mother with children under 18 | 793,333 | 6.9% | $40,464 | 19.9% | $8,052 | 10.3 | — | — |
| Texas | Family type | Single father with children under 18 | 268,294 | 2.3% | $60,910 | 14.6% | $8,884 | 7.6 | — | — |
| Dallas County | All households | All households | 982,737 | 100.0% | $77,542 | 13.1% | $10,130 | 6.8 | 49% | 13.9% |
| Dallas County | Race / ethnicity of householder | White, not Hispanic | 334,201 | 34.0% | $103,606 | 11.7% | $12,148 | 6.1 | 39% | 7.1% |
| Dallas County | Race / ethnicity of householder | Hispanic or Latino | 306,427 | 31.2% | $69,809 | 13.8% | $9,614 | 7.2 | 48% | 16.1% |
| Dallas County | Race / ethnicity of householder | Black or African American | 246,081 | 25.0% | $59,130 | 14.7% | $8,721 | 7.7 | 63% | 19.8% |
| Dallas County | Race / ethnicity of householder | Asian | 67,702 | 6.9% | $110,384 | 11.4% | $12,608 | 5.9 | 48% | 9.5% |
| Dallas County | Age of householder | Under 25 | 48,544 | 4.9% | $49,930 | 15.6% | $7,784 | 8.1 | 90% | — |
| Dallas County | Age of householder | 25 to 44 | 402,212 | 40.9% | $82,242 | 12.7% | $10,431 | 6.6 | 65% | — |
| Dallas County | Age of householder | 45 to 64 | 342,556 | 34.9% | $87,431 | 12.5% | $10,885 | 6.5 | 37% | — |
| Dallas County | Age of householder | 65 and over | 189,425 | 19.3% | $58,968 | 14.8% | $8,706 | 7.7 | 27% | — |
| Dallas County | Family type | Married couple with children under 18 | 177,025 | 18.0% | $108,596 | 11.5% | $12,490 | 6.0 | — | — |
| Dallas County | Family type | Married couple, no children under 18 | 236,915 | 24.1% | $115,616 | 11.2% | $12,934 | 5.8 | — | — |
| Dallas County | Family type | Single mother with children under 18 | 75,776 | 7.7% | $40,145 | 20.1% | $8,054 | 10.4 | — | — |
| Dallas County | Family type | Single father with children under 18 | 19,445 | 2.0% | $51,413 | 15.5% | $7,946 | 8.0 | — | — |
| HD109 | All households | All households | 63,170 | 100.0% | $77,765 | 13.0% | $10,144 | 6.8 | 29% | 13.1% |
| HD109 | Race / ethnicity of householder | White, not Hispanic | 9,435 | 14.9% | $80,580 | 12.8% | $10,303 | 6.6 | 23% | 11.1% |
| HD109 | Race / ethnicity of householder | Hispanic or Latino | 14,800 | 23.4% | $79,822 | 12.9% | $10,262 | 6.7 | 17% | 15.1% |
| HD109 | Race / ethnicity of householder | Black or African American | 35,664 | 56.5% | $77,169 | 13.1% | $10,108 | 6.8 | 36% | 12.6% |
| HD109 | Race / ethnicity of householder | Asian | 967 | 1.5% | $95,793 | 12.1% | $11,568 | 6.3 | 13% | 7.8% |
| HD109 | Age of householder | Under 25 | 1,063 | 1.7% | $50,961 | 15.5% | $7,897 | 8.1 | 60% | — |
| HD109 | Age of householder | 25 to 44 | 22,503 | 35.6% | $77,907 | 13.0% | $10,152 | 6.8 | 40% | — |
| HD109 | Age of householder | 45 to 64 | 26,752 | 42.3% | $88,236 | 12.4% | $10,954 | 6.5 | 25% | — |
| HD109 | Age of householder | 65 and over | 12,852 | 20.3% | $61,280 | 14.6% | $8,918 | 7.6 | 18% | — |
| HD109 | Family type | Married couple with children under 18 | 12,295 | 19.5% | $111,410 | 11.4% | $12,674 | 5.9 | — | — |
| HD109 | Family type | Married couple, no children under 18 | 16,447 | 26.0% | $111,769 | 11.4% | $12,696 | 5.9 | — | — |
| HD109 | Family type | Single mother with children under 18 | 6,757 | 10.7% | $55,587 | 15.1% | $8,379 | 7.8 | — | — |
| HD109 | Family type | Single father with children under 18 | 1,656 | 2.6% | $37,175 | 21.6% | $8,019 | 11.2 | — | — |
| Area | Fifth | Households | Mean income | Share of income | Texas taxes per household | Direct | Indirect | Total borne |
|---|---|---|---|---|---|---|---|---|
| Texas (5-yr) | Q1 | 2,198,563 | $17,295 | 31.7% | $5,478 | $2,851 | $2,627 | $12.044B |
| Texas (5-yr) | Q2 | 2,198,563 | $47,917 | 16.1% | $7,720 | $4,182 | $3,539 | $16.974B |
| Texas (5-yr) | Q3 | 2,198,563 | $80,053 | 12.8% | $10,275 | $5,659 | $4,615 | $22.589B |
| Texas (5-yr) | Q4 | 2,198,563 | $126,314 | 10.7% | $13,525 | $7,877 | $5,648 | $29.736B |
| Texas (5-yr) | Q5 | 2,198,563 | $285,230 | 8.8% | $24,974 | $14,918 | $10,057 | $54.907B |
| Texas (5-yr) | All | 10,992,816 | $111,362 | 11.1% | $12,395 | $7,097 | $5,297 | $136.251B |
| Dallas County | Q1 | 196,547 | $18,217 | 31.2% | $5,685 | $2,962 | $2,723 | $1.117B |
| Dallas County | Q2 | 196,547 | $48,870 | 15.7% | $7,667 | $4,157 | $3,509 | $1.507B |
| Dallas County | Q3 | 196,547 | $78,254 | 13.0% | $10,173 | $5,598 | $4,574 | $1.999B |
| Dallas County | Q4 | 196,547 | $121,993 | 10.9% | $13,299 | $7,705 | $5,594 | $2.614B |
| Dallas County | Q5 | 196,547 | $301,987 | 8.7% | $26,254 | $15,694 | $10,560 | $5.160B |
| Dallas County | All | 982,737 | $113,864 | 11.1% | $12,615 | $7,223 | $5,392 | $12.398B |
| HD109 | Q1 | 12,634 | $20,606 | 30.0% | $6,180 | $3,230 | $2,950 | $0.078B |
| HD109 | Q2 | 12,634 | $51,668 | 15.4% | $7,973 | $4,330 | $3,644 | $0.101B |
| HD109 | Q3 | 12,634 | $78,992 | 12.9% | $10,215 | $5,624 | $4,592 | $0.129B |
| HD109 | Q4 | 12,634 | $117,910 | 11.1% | $13,070 | $7,535 | $5,534 | $0.165B |
| HD109 | Q5 | 12,634 | $218,103 | 9.6% | $20,839 | $12,326 | $8,513 | $0.263B |
| HD109 | All | 63,170 | $97,456 | 12.0% | $11,656 | $6,609 | $5,046 | $0.736B |
| Data element | Publisher | Official source | Accessed |
|---|---|---|---|
| Current Texas state taxes, FY2025 | Texas Comptroller of Public Accounts | https://comptroller.texas.gov/transparency/reports/cash-report/ | 2026-10-20 |
| Property tax levies, TY2025 | Texas Comptroller, Property Tax Assistance Division | https://comptroller.texas.gov/taxes/property-tax/rates/ | 2026-10-20 |
| Local sales tax allocations, CY2025 | Texas Comptroller / Texas Open Data Portal | https://data.texas.gov/dataset/vfba-b57j | 2026-10-20 |
| Other local taxes, FY2024 | U.S. Census Bureau | https://www.census.gov/data/datasets/2024/econ/local/public-use-datasets.html | 2026-10-20 |
| Tax incidence tables | Texas Comptroller (Pub. 96-463) | https://comptroller.texas.gov/transparency/reports/tax-exemptions-and-incidence/ | 2026-10-22 |
| Spending by income quintile, 2022–23 | U.S. Bureau of Labor Statistics | https://www.bls.gov/cex/tables/geographic/mean/2023/cu-state-tx-income-quintiles-before-taxes-2-year-average-2023.htm | 2026-10-22 |
| Price changes, 2021–2025 | U.S. Bureau of Labor Statistics | https://www.bls.gov/regions/southwest/data/consumerpriceindexaahistorical_southwest_table.htm | 2026-10-22 |
| Households, income, tenure (Texas) | U.S. Census Bureau, ACS 2024 1-year | https://data.census.gov/ | 2026-10-22 |
| Texas, Dallas County, HD109 | U.S. Census Bureau, ACS 2020–2024 5-year | https://data.census.gov/ | 2026-10-22 |
| Property tax share of rent | National Apartment Association | https://naahq.org/research/dollar-rent-tool | 2026-10-22 |
| Property tax share of rent, 2026 | National Apartment Association (Yardi Matrix data) | https://naahq.org/news/expense-watch-property-taxes-continue-rise-across-us-apartment-markets | 2026-10-22 |
| Property tax share of rent, testimony | Texas Apartment Association | https://www.taa.org/wp-content/uploads/2024/12/09-04-24-senate-finance-written-testimony-signed.pdf | 2026-10-22 |
| State and local taxes, all states, FY2024 | U.S. Census Bureau, Government Finances | https://www.census.gov/data/datasets/2024/econ/local/public-use-datasets.html | 2026-10-23 |
| Personal income and price parities by state | U.S. Bureau of Economic Analysis | https://apps.bea.gov/regional/downloadzip.htm | 2026-10-23 |
| Business taxes by state, FY2024 | Ernst & Young / Council On State Taxation | https://www.cost.org/globalassets/cost/stri/studies-and-reports/2511-10951-cs-50-state-report-v10.pdf | 2026-10-23 |
| Distribution of taxes by income, all states | Institute on Taxation and Economic Policy | https://itep.org/whopays-7th-edition/ | 2026-10-23 |
| State tax competitiveness rankings | Tax Foundation | https://taxfoundation.org/research/all/state/2026-state-tax-competitiveness-index/ | 2026-10-23 |
| Texas small business profile | U.S. Small Business Administration | https://advocacy.sba.gov/wp-content/uploads/2025/06/Texas_2025-State-Profile.pdf | 2026-10-23 |
| Franchise tax thresholds and rules | Texas Comptroller | https://comptroller.texas.gov/taxes/franchise/ | 2026-10-23 |
| Business personal property exemption | Texas Comptroller | https://comptroller.texas.gov/taxes/property-tax/docs/96-1425.pdf | 2026-10-23 |
| Population, race, age, income by group (Texas) | U.S. Census Bureau, ACS 2024 1-year | https://data.census.gov/ | 2026-10-22 |
| Population, race, age, income by group (local) | U.S. Census Bureau, ACS 2020–2024 5-year | https://data.census.gov/ | 2026-10-22 |
| Living wage budgets, Texas | Massachusetts Institute of Technology | https://livingwage.mit.edu/states/48 | 2026-10-22 |
| Living wage budgets, Dallas County | Massachusetts Institute of Technology | https://livingwage.mit.edu/counties/48113 | 2026-10-22 |
| Consumer spending, national accounts | U.S. Bureau of Economic Analysis | https://apps.bea.gov/regional/downloadzip.htm | 2026-10-21 |
References
Sources are organized by the sections of this article they principally inform. All sources are official government data, statutes, official statements or original published research.
The Texas Tax System and Its Tiers — Sections 1, 2, 4 and 13
Office of the Governor. (2025, May 5). Governor Abbott recognizes 2025 Travel and Tourism Week in Texas [Press release]. https://gov.texas.gov/news/post/governor-abbott-recognizes-2025-travel-and-tourism-week-in-texas
Reports Travel Texas research showing 62 million travelers visited Texas in 2024 from other states and countries, alongside more than 67 million Texans on overnight trips within the state. It supports the reason hotel occupancy taxes are excluded: they are paid by visitors and business travel as well as Texans.
Tex. Tax Code ch. 151 (2025). Limited sales, excise, and use tax. https://statutes.capitol.texas.gov/Docs/TX/htm/TX.151.htm
The state sales tax statute, including the exemptions for groceries and residential utilities. Used to identify which spending lines are taxable at checkout.
Texas Comptroller of Public Accounts. (2025a). State of Texas 2025 annual cash report: Revenues and expenditures of state funds for the year ended August 31, 2025 (Publication 96-368). https://comptroller.texas.gov/transparency/reports/cash-report/
The official record of every state tax collected in fiscal 2025, by revenue object. It supplies the state tax amounts allocated in this article.
Texas Comptroller of Public Accounts. (2025b, January). Tax exemptions & tax incidence: A report to the Governor and the 89th Texas Legislature (Publication 96-463). https://comptroller.texas.gov/transparency/reports/tax-exemptions-and-incidence/
The Comptroller’s required study of who pays Texas taxes. Its tables show the initial payers and the final bearers of eight major taxes by household income quintile, tenure and export. Those shares drive every household figure in this article.
Texas Comptroller of Public Accounts. (2026b). Property tax exemptions. https://comptroller.texas.gov/taxes/property-tax/exemptions/
Confirms the school district residence homestead exemption of $140,000, the additional $60,000 school exemption for homeowners 65 or older or disabled, and that the exemption applies only to a principal residence. Cited to note that the incidence study predates these amounts, that rental homes receive no homestead exemption (Section 5), and that senior estimates in Section 10 do not reflect the additional exemption.
Texas Comptroller of Public Accounts. (2026c). Sales tax allocation: City; County, MTA, SPD [Data sets]. Texas Open Data Portal. https://data.texas.gov/dataset/vfba-b57j
Monthly local sales tax allocations to cities, counties, transit authorities and special purpose districts. It supplies the calendar-2025 local sales tax total.
Texas Comptroller of Public Accounts, Property Tax Assistance Division. (2026a). 2025 tax rates and levies: Counties, cities, school districts, and special districts [Data set]. https://comptroller.texas.gov/taxes/property-tax/rates/
Tax-year 2025 property tax levies for every taxing unit in Texas. It supplies the property tax totals in Sections 1 and 4.
U.S. Census Bureau. (2026a). 2024 state & local government finance datasets and tables: Individual unit files [Data set]. https://www.census.gov/data/datasets/2024/econ/local/public-use-datasets.html
Census survey of state and local government finances, fiscal 2024. It supplies local utility, vehicle registration, license and other taxes that are not in the Comptroller’s sales or property tax data, and the state and local tax totals by type for all 50 states used in Section 12.
Businesses and Texas Among the States — Sections 11 and 12
Ernst & Young LLP, Council On State Taxation, & State Tax Research Institute. (2025, December). Total state and local business taxes: State-by-state estimates for FY24. https://www.cost.org/globalassets/cost/stri/studies-and-reports/2511-10951-cs-50-state-report-v10.pdf
The 23rd annual estimate of state and local taxes paid by businesses in every state, built from Census government finance data. It supplies Texas business taxes by type, the business share of taxes and the business tax rate for all 50 states. The study is sponsored by a business tax organization; its methods are documented.
Institute on Taxation and Economic Policy. (2024, January). Who pays? A distributional analysis of the tax systems in all 50 states (7th ed.). https://itep.org/whopays-7th-edition/
A microsimulation study of state and local taxes as a share of family income by income group in every state, with a Texas profile at https://itep.org/whopays/texas-who-pays-7th-edition/. It ranks Texas the 7th most regressive system. ITEP measures tax fairness by income; its figures exclude seniors.
Tax Foundation. (2025, October). 2026 State Tax Competitiveness Index. https://taxfoundation.org/research/all/state/2026-state-tax-competitiveness-index/
Scores each state’s tax structure on competitiveness as of July 1, 2025, ranking Texas 7th overall and by component. The index measures structure and competitiveness, not how much residents pay or who bears it.
Texas Comptroller of Public Accounts. (n.d.). Franchise tax overview (Publication 98-806). https://comptroller.texas.gov/taxes/publications/98-806.php
Lists the entities that do not owe franchise tax, including sole proprietorships and general partnerships owned entirely by individuals.
Texas Comptroller of Public Accounts. (2025c, December). Texas is open for small business. Fiscal Notes. https://comptroller.texas.gov/economy/fiscal-notes/industry/2025/small-biz-info/
The Comptroller’s summary of small-business facts, including the increase in the business personal property exemption to $125,000 from $2,500 and the $2.65 million franchise tax threshold for 2026.
Texas Comptroller of Public Accounts. (2026a). Franchise tax: Tax rates, thresholds and deduction limits. https://comptroller.texas.gov/taxes/franchise/
Official franchise tax rates and the no-tax-due revenue thresholds by report year ($2.47 million for 2024–2025; $2.65 million for 2026–2027).
Texas Comptroller of Public Accounts, Property Tax Assistance Division. (2026b, January). Texas property tax basics (Publication 96-1425). https://comptroller.texas.gov/taxes/property-tax/docs/96-1425.pdf
States the $125,000 exemption for income-producing tangible personal property under Tax Code §11.145(b).
U.S. Bureau of Economic Analysis. (2026a). SAINC1 state personal income summary and SARPP regional price parities by state [Data set]. https://apps.bea.gov/regional/downloadzip.htm
Official state personal income, population and price-level data for 2023–2024. It supplies taxes as a share of personal income, prices relative to the U.S. and price-adjusted income in Section 12.
U.S. Small Business Administration, Office of Advocacy. (2025). 2025 small business profile: Texas. https://advocacy.sba.gov/wp-content/uploads/2025/06/Texas_2025-State-Profile.pdf
Federal profile of Texas small businesses from Census business statistics: 3.5 million small businesses, 99.8% of all businesses, employing 44.4% of Texas workers.
Households, Rent, Income, Spending and People — Sections 3, 5, 6, 8, 9 and 10
Bajomo, E. (2026, October 15). Expense watch: Property taxes continue to rise across U.S. apartment markets. National Apartment Association. https://naahq.org/news/expense-watch-property-taxes-continue-rise-across-us-apartment-markets
Yardi Matrix Financial Benchmarking Data for the 12 months ending July 2026, showing property taxes as a share of total income for market-rate apartments by market, including Austin, Dallas and Fort Worth. A second, independent data source for the rent share.
National Apartment Association. (2025). Dollar of rent tool [Interactive data tool and data file]. Data: STATVAL (Multifamily Comps). https://naahq.org/research/dollar-rent-tool
Breaks down each dollar of apartment rent into property taxes, operating costs, payroll, capital reserves, mortgage and profit for Texas and its metros, 2023–2025, from standardized operating statements drawn from CMBS trustee reports and lender appraisals. It supplies the measured share of rent that pays the owner’s property taxes in Section 5.
Texas Apartment Association. (2024, September 4). Written testimony to the Senate Committee on Finance [Testimony]. https://www.taa.org/wp-content/uploads/2024/12/09-04-24-senate-finance-written-testimony-signed.pdf
The statewide rental-housing association’s signed testimony, stating that approximately 20% of every rent dollar paid by Texas renters goes toward property taxes. An industry statement without a published method; used as the upper end of the range.
U.S. Bureau of Economic Analysis. (2026b). SAPCE: Personal consumption expenditures by state, 1997–2025 [Data set]. https://apps.bea.gov/regional/downloadzip.htm
Texas consumer spending by category from the national accounts. Used only to show how much spending the federal survey captures.
U.S. Bureau of Labor Statistics. (2024). Texas: Quintiles of income before taxes, 2022–2023 [Consumer Expenditure Surveys state-level research table]. https://www.bls.gov/cex/tables/geographic/mean/2023/cu-state-tx-income-quintiles-before-taxes-2-year-average-2023.htm
Average spending, income and household characteristics for Texas consumer units by income quintile. It supplies the spending patterns in Section 6 and divides directly paid taxes among income groups.
U.S. Bureau of Labor Statistics. (2026). Consumer Expenditure Surveys: Questions and answers. https://www.bls.gov/cex/csxfaqs.htm
BLS notice that state tables ended in 2026, with Texas available for 2017–2023. Documents why 2022–2023 is the latest Texas table.
U.S. Bureau of Labor Statistics, Southwest Information Office. (2026). Consumer Price Index, annual average historical, 2021–2025. https://www.bls.gov/regions/southwest/data/consumerpriceindexaahistorical_southwest_table.htm
Annual price changes by category for the Dallas–Fort Worth area. Used to express spending and income in 2025 dollars.
U.S. Census Bureau. (2025). American Community Survey 2024 1-year estimates: Detailed tables [Data set]. https://data.census.gov/
Household counts, income quintiles, household types, tenure, rent, renters and rent by type of structure, home values and real estate taxes for Texas, plus population by age, race and ethnicity, median income by race, age of householder and family type, and poverty. It supplies the statewide household, income, rental and demographic figures in Sections 3, 5, 7, 10 and 12. Any table can be opened directly, for example https://data.census.gov/table/ACSDT1Y2024.B19081?g=040XX00US48 (household income quintile means, Texas); replace the table ID (B19081) to open the others.
U.S. Census Bureau. (2026b). American Community Survey 2020–2024 5-year estimates: Detailed tables [Data set]. https://data.census.gov/
Five-year estimates for Texas, Dallas County and State House District 109 (2024 plan), the only Census income series published for state House districts, including renters and rent by type of structure, home values, population by race, ethnicity and age, and median income by group. It supplies the local figures in Sections 5, 8, 9 and 10. Any table can be opened directly, for example https://data.census.gov/table/ACSDT5Y2024.B19081?g=620L900US48109 (State House District 109); use g=050XX00US48113 for Dallas County.
Living Wage — Section 7
Glasmeier, A. K. (2026a). Living wage calculator: Dallas County, Texas. Massachusetts Institute of Technology. https://livingwage.mit.edu/counties/48113
Basic-needs budgets and living wages for 12 household types in Dallas County, which includes House District 109 (February 2026 release, 2025 dollars). It supplies the Dallas County budgets in Section 7.
Glasmeier, A. K. (2026b). Living wage calculator: Texas. Massachusetts Institute of Technology. https://livingwage.mit.edu/states/48
Basic-needs budgets and living wages for 12 household types for Texas as a whole (February 2026 release, 2025 dollars). It supplies the statewide family and single-adult budgets in Section 7.
Glasmeier, A. K. (2026c). Methodology. Living wage calculator. Massachusetts Institute of Technology. https://livingwage.mit.edu/pages/methodology
Explains the calculator’s data and confirms that sales and property taxes are already inside each basic-needs cost.