
Who Is Really Paying More? What the “OBBBA” Impact Actually Was
Who Is Really Paying More? What the OBBBA’s Impact Actually Was
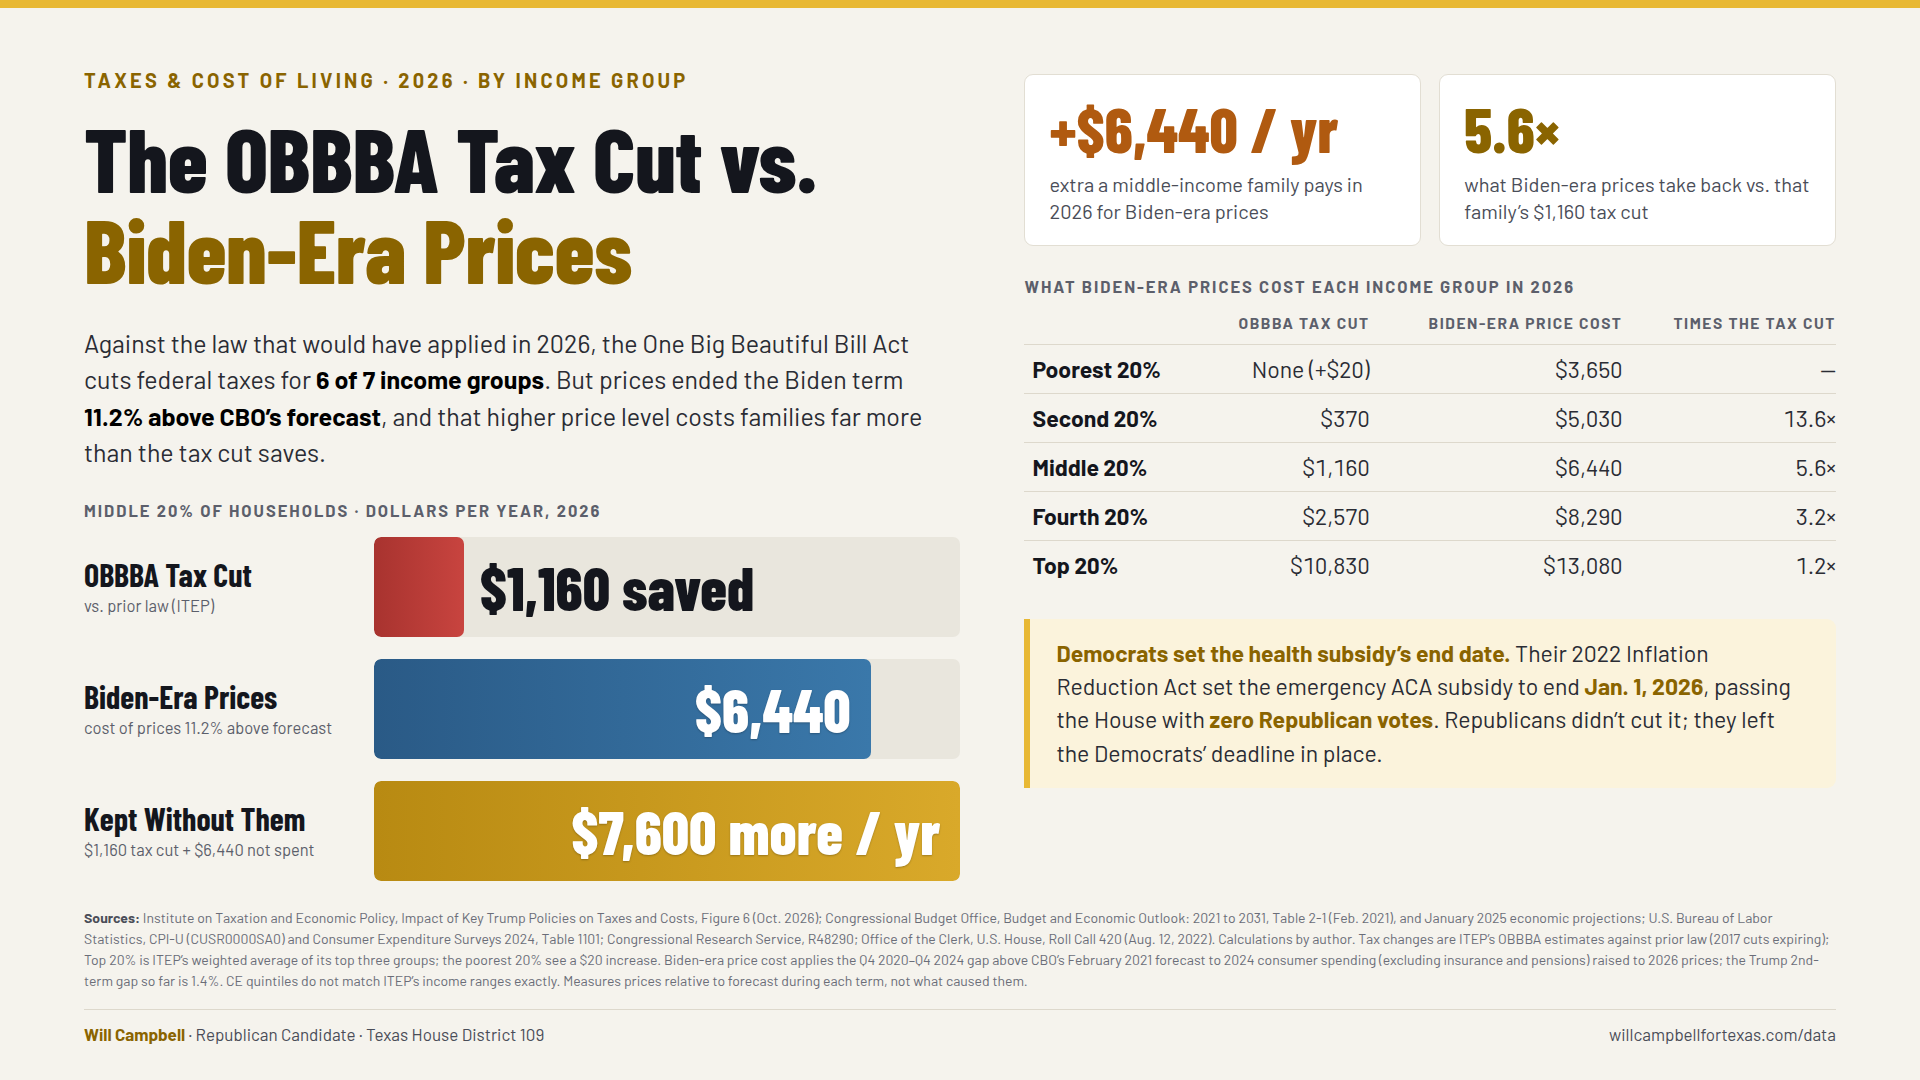
The One Big Beautiful Bill Act cut 2026 federal taxes for six of seven income groups, including $1,160 for a middle-income household. What families feel instead is prices: the Biden-era increase above forecast costs that same household about $6,440 this year, more than five times the tax savings.
Executive Summary
The key findings of this report at a glance
A graphic from the Institute on Taxation and Economic Policy (ITEP) says every income group except the richest 1% is “paying more” in 2026 because of President Trump’s tax and economic policies. We downloaded ITEP’s own data, CBO’s forecasts, and BLS price data to see what is inside those numbers. [ITEP, 2026a]
- The graphic adds three different things together. Its totals combine (a) new tax provisions in the One Big Beautiful Bill Act (OBBBA), (b) the expiration of an enhanced health-insurance tax credit, and (c) prices that rose faster than a CBO forecast. ITEP’s arithmetic is correct; the label is the problem. Section 1
- On taxes alone, the OBBBA is a tax cut for six of seven income groups. Measured against the law that would otherwise have applied in 2026, when the 2017 tax cuts were set to expire, the middle 20% pays $1,160 less and the fourth 20% pays $2,570 less, by ITEP’s own figures. The graphic leaves those extensions out. Section 2
- The health-credit increase was scheduled by Democrats. The enhanced credit was created by the American Rescue Plan and extended by the Inflation Reduction Act only through 2025. Both passed without a single Republican vote. The OBBBA did not change the expiration date. Section 3
- Most of the “paying more” is prices, measured against a forecast. Prices make up 93% of the average added cost. As of the third quarter of 2026, prices were 1.4% above what CBO forecast in January 2025, and about 54% of that gap built up after the Iran war began. Section 4
- The same test is about 8 times worse for the Biden term, and it outweighs the tax cut. Prices ended the Biden term 11.2% above the forecast CBO made in February 2021. Applied to actual household spending, that gap costs a middle-income household about $6,440 in 2026, 5.6 times its $1,160 OBBBA tax cut. Without the Biden-era increase, that household would keep about $7,600 more a year. Section 5
- What is fair to say. The richest 1% do receive the largest tax cuts in dollars, and tariffs have raised some prices. But “every income group is paying more because of Trump’s tax policies” is not what ITEP’s own tax numbers show. Section 6
The OBBBA lowers federal taxes for most working families in 2026. The price increases families feel are real, but most of today’s price level was set from 2021 to 2024, and that Biden-era increase costs the typical family several times what the tax cut saves. Section 7
What the Graphic Adds Together
Three different things are combined into one number for each income group
This post shares a graphic from the Institute on Taxation and Economic Policy (ITEP). It shows one bar per income group: +$750 for the poorest 20%, +$1,700 for the middle 20%, and −$12,560 for the richest 1%. Its own footnote explains that each bar adds together three separate items: new tax policies in the OBBBA, the expiration of the Enhanced Premium Tax Credit, and “price increases occurring during Trump’s second term beyond what was initially projected.” [ITEP, 2026a]
ITEP’s full report breaks each bar into those three pieces, and we downloaded the underlying data file. The pieces add up exactly to the graphic’s totals. For the middle 20%, the +$1,700 is $1,850 in higher prices, $230 from the health credit expiring, and a $380 tax cut from new OBBBA policies. [ITEP, 2026b]
So the graphic is not mainly about taxes. Across all households, prices account for $2,260 of the $2,420 in added costs, or 93%. For every group from the middle 20% up, the OBBBA’s new tax policies are a cut, not an increase.
| Income group | Income range | Avg. income | Prices above forecast | EPTC expiration | OBBBA new tax policies | Graphic total |
|---|---|---|---|---|---|---|
| Poorest 20% | $0–$23,500 | $12,900 | +$530 | +$130 | +$90 | +$750 |
| Second 20% | $23,500–$46,600 | $34,400 | +$1,170 | +$420 | $0 | +$1,590 |
| Middle 20% | $46,600–$80,100 | $62,000 | +$1,850 | +$230 | −$380 | +$1,700 |
| Fourth 20% | $80,100–$148,300 | $109,100 | +$2,760 | +$40 | −$1,070 | +$1,730 |
| Next 15% | $148,300–$360,000 | $217,700 | +$3,920 | $0 | −$2,230 | +$1,690 |
| Next 4% | $360,000–$960,600 | $539,500 | +$5,700 | $0 | −$4,580 | +$1,120 |
| Richest 1% | $960,600+ | $2,848,700 | +$15,990 | $0 | −$28,550 | −$12,560 |
| All households | $125,100 | +$2,260 | +$160 | −$1,070 | +$1,360 |
Taxes Alone: The OBBBA Cut Taxes for Most Households
The graphic’s tax figure leaves out the law’s biggest provision for working families
The 2017 tax cuts (lower rates, a larger standard deduction, and a $2,000 child credit) were written to expire at the end of 2025. Without the OBBBA, nearly every household would have faced a tax increase on January 1, 2026. The OBBBA made those provisions permanent. [ITEP, 2026a]
ITEP’s graphic counts only the OBBBA’s new tax policies and treats the extensions as if they had already been law. ITEP’s own Figure 6 shows the other comparison, against the law that would otherwise have applied. On that basis, the OBBBA cuts taxes for six of seven income groups:
- Middle 20%: $1,160 less in federal taxes in 2026
- Second 20%: $370 less; fourth 20%: $2,570 less
- Poorest 20%: +$20, essentially no change, because many in this group owe no income tax
Even after adding the health-credit expiration, taxes are lower for the middle 20% and every group above it. The richest 1% receive the largest cut in dollars, which is a fair point for critics. But the claim that “every income group is paying more” does not hold for taxes.
ITEP groups the tax breaks on tips, overtime, car-loan interest, and the extra senior deduction as “politically prominent proposals.” They save the middle 20% about $310 and the fourth 20% about $630 in 2026, on top of the rate and child-credit extensions. [ITEP, 2026a]
| Income group | Extensions of 2017 cuts | New OBBBA policies | Net vs. prior law | Plus EPTC expiration | Graphic’s tax figure |
|---|---|---|---|---|---|
| Poorest 20% | −$70 | +$90 | +$20 | +$150 | +$220 |
| Second 20% | −$370 | $0 | −$370 | +$50 | +$420 |
| Middle 20% | −$780 | −$380 | −$1,160 | −$930 | −$150 |
| Fourth 20% | −$1,500 | −$1,070 | −$2,570 | −$2,530 | −$1,030 |
| Next 15% | −$3,030 | −$2,230 | −$5,260 | −$5,260 | −$2,230 |
| Next 4% | −$12,300 | −$4,580 | −$16,880 | −$16,880 | −$4,580 |
| Richest 1% | −$41,690 | −$28,550 | −$70,240 | −$70,240 | −$28,550 |
| All households | −$1,900 | −$1,070 | −$2,970 | −$2,810 | −$910 |
| Provision (vs. prior law) | Bottom 20% | Second 20% | Middle 20% | Fourth 20% | Next 15% | Next 4% | Top 1% | Total |
|---|---|---|---|---|---|---|---|---|
| Changes to rates and brackets | $0 | −$90 | −$530 | −$1,460 | −$3,010 | −$1,100 | −$29,000 | −$1,200 |
| Standard deduction, personal exemption, Child Tax Credit | −$60 | −$330 | −$410 | −$370 | −$20 | −$160 | −$160 | −$240 |
| Pass-through businesses deduction | $0 | −$10 | −$30 | −$80 | −$390 | −$2,270 | −$22,350 | −$390 |
| More generous Alternative Minimum Tax (AMT) | $0 | $0 | $0 | −$10 | −$670 | −$12,170 | −$7,950 | −$670 |
| Changes to itemized deductions including SALT cap & others | $0 | $0 | $20 | $60 | $220 | $2,110 | $26,020 | $390 |
| Estate and gift tax | $0 | $0 | $0 | −$30 | −$190 | −$940 | −$4,420 | −$120 |
| Politically prominent proposals* | $0 | −$80 | −$310 | −$630 | −$800 | −$180 | −$40 | −$330 |
| Limit Affordable Care Act credits | $90 | $130 | $120 | $40 | $0 | $0 | $0 | $80 |
| Limit/repeal green energy provisions | $10 | $30 | $70 | $130 | $280 | $690 | $4,380 | $160 |
| Changes for corporations and other businesses | −$10 | −$30 | −$80 | −$220 | −$680 | −$2,870 | −$36,730 | −$650 |
| Total combined impact | $20 | −$370 | −$1,160 | −$2,570 | −$5,260 | −$16,880 | −$70,240 | −$2,970 |
| Income group (Texas) | Income range | Avg. income | Prices above forecast | EPTC expiration | OBBBA new tax policies | Total (graphic method) | Taxes only (EPTC + OBBBA) |
|---|---|---|---|---|---|---|---|
| Poorest 20% | $0–$21,700 | $11,900 | +$500 | +$190 | +$130 | +$820 | +$320 |
| Second 20% | $21,700–$42,400 | $31,300 | +$1,120 | +$620 | +$110 | +$1,850 | +$730 |
| Middle 20% | $42,400–$73,800 | $56,800 | +$1,790 | +$370 | −$220 | +$1,940 | +$150 |
| Fourth 20% | $73,800–$140,300 | $101,400 | +$2,770 | +$80 | −$900 | +$1,940 | −$820 |
| Next 15% | $140,300–$350,000 | $208,800 | +$4,010 | $0 | −$1,820 | +$2,200 | −$1,820 |
| Next 4% | $350,000–$922,500 | $521,500 | +$5,960 | $0 | −$3,440 | +$2,520 | −$3,440 |
| Richest 1% | $922,500–and above | $2,845,600 | +$16,840 | $0 | −$29,610 | −$12,770 | −$29,610 |
| All households | $119,500 | +$2,240 | +$250 | −$870 | +$1,620 | −$620 |
The Health Credit Was Written to Expire
Democrats set the end date in 2022; the OBBBA did not change it
The second piece of the graphic is the end of the Enhanced Premium Tax Credit, a larger subsidy for health plans bought through the Affordable Care Act marketplace. It is presented as a Trump policy. The legislative record shows otherwise. [CRS, 2026a]
- The American Rescue Plan (March 2021) created the enhanced credit for 2021 and 2022 only. It passed the House 220–211 with no Republican votes. [House Clerk, 2021]
- The Inflation Reduction Act (August 2022) extended it through 2025 and set the sunset date of January 1, 2026. It passed the House 220–207 with no Republican votes. [Congress.gov, 2022] [House Clerk, 2022]
- The OBBBA changed other credit rules (eligibility checks and repayment) but, according to the Congressional Research Service, “did not affect expiration of the enhanced PTC.” [CRS, 2026a]
The basic premium credit continues in 2026; only the temporary enhancement ended. [IRS, n.d.] Critics argue Congress should have extended it, and that is a fair policy debate. But the increase follows the date Democrats wrote into law, not a change made by the OBBBA. In Texas, where marketplace enrollment is high, ITEP estimates this piece at about $620 for the second 20%. [ITEP, 2026b]
| Date | Law | What it did to the enhanced credit | Final House vote |
|---|---|---|---|
| Mar 11, 2021 | American Rescue Plan Act (P.L. 117-2) | Created the enhanced credit for tax years 2021 and 2022 | 220–211; 0 Republican yeas |
| Aug 16, 2022 | Inflation Reduction Act (P.L. 117-169) | Extended it for 2023–2025 and set the sunset: January 1, 2026 | 220–207; 0 Republican yeas |
| Jul 4, 2025 | One Big Beautiful Bill Act (P.L. 119-21) | Did not change the expiration date (other credit rules changed) | 218–214 |
| Jan 1, 2026 | — | Enhanced credit expires as scheduled; the base credit continues | — |
The Price Piece Is Measured Against a Forecast
Most of the “paying more” is prices rising faster than CBO predicted, and much of that came with the Iran war
The largest part of every bar is prices. ITEP does not measure how much prices rose. It measures the gap between actual inflation and what the Congressional Budget Office forecast in January 2025, then attributes that whole gap to Trump’s policies, naming tariffs, the Iran war, and immigration. [ITEP, 2026a]
We rebuilt that gap from CBO’s published forecast and BLS data. From the fourth quarter of 2024 to the third quarter of 2026, CBO forecast prices would rise 4.2%. They actually rose 5.6%, leaving prices 1.4% above the forecast. [CBO, 2025a] [BLS, 2026a]
The timing matters. By the first quarter of 2026, after a year of tariffs, prices were only 0.64% above forecast. The gap more than doubled after the United States and Israel began military operations against Iran on February 28, 2026, and gasoline jumped 21% in a single month. [CRS, 2026b] About 54% of the gap built up after that. Had all prices grown like non-energy prices after February 2026, the price level in the third quarter would have been about 0.9% lower, which is roughly 62% of the gap.
Tariffs did raise some prices. A Federal Reserve analysis estimates they added about 0.8% to core PCE prices through February 2026 (a different price index than the CPI). [Minton et al., 2026] But a gap against a forecast is not the same as a policy effect. Forecasts miss for many reasons, and a war-driven oil shock is the kind of event no forecast includes.
| Quarter | Actual CPI-U (SA, avg.) | CBO Jan 2025 forecast | Actual change since Q4 2024 | Forecast change | Prices above forecast |
|---|---|---|---|---|---|
| Q4 2024 | 316.588 | 316.169 | +0.00% | +0.00% | 0.00% |
| Q1 2025 | 319.475 | 317.891 | +0.91% | +0.55% | 0.36% |
| Q2 2025 | 320.786 | 319.537 | +1.33% | +1.06% | 0.26% |
| Q3 2025 | 323.235 | 321.487 | +2.10% | +1.68% | 0.41% |
| Q4 2025 † | 325.547 | 323.556 | +2.83% | +2.34% | 0.48% |
| Q1 2026 | 328.114 | 325.581 | +3.64% | +2.98% | 0.65% |
| Q2 2026 | 332.985 | 327.493 | +5.18% | +3.58% | 1.54% |
| Q3 2026 | 334.414 | 329.398 | +5.63% | +4.18% | 1.39% |
| Month | Actual CPI-U (SA) | Without energy shock | Gap |
|---|---|---|---|
| Feb 2026 | 327.460 | 327.460 | 0.00% |
| Mar 2026 | 330.293 | 328.004 | 0.70% |
| Apr 2026 | 332.407 | 329.300 | 0.94% |
| May 2026 | 333.979 | 329.961 | 1.22% |
| Jun 2026 | 332.568 | 330.013 | 0.77% |
| Jul 2026 | 332.813 | 330.657 | 0.65% |
| Aug 2026 | 334.131 | 331.535 | 0.78% |
| Sep 2026 | 336.298 | 332.506 | 1.14% |
The Same Test Applied to the Biden Term
Measured ITEP’s way, the Biden-era price gap was about eight times larger
If prices running ahead of CBO’s forecast counts as a cost of the current administration’s policies, the same yardstick should apply to the last one. In February 2021, CBO forecast that consumer prices would rise 1.9% in 2021, 2.2% in 2022, 2.3% in 2023, and 2.4% in 2024. [CBO, 2021]
Actual inflation was 6.8%, 7.1%, 3.2%, and 2.7%. Over the four years, CBO expected prices to rise 9.1%; they rose 21.3%. Prices ended the Biden term 11.2% above forecast, about 8 times the 1.4% gap so far under Trump II. Even per year, the Biden-term gap (2.7% a year) was about 3 times as fast. [BLS, 2026a]
What the Biden-Era Increase Costs Families Compared With the Tax Cut
Because prices rarely fall, that higher price level is still built into what families pay in 2026. To put a dollar figure on it, we applied both forecast gaps to what households actually spend, using the Bureau of Labor Statistics Consumer Expenditure Survey for 2024, brought to 2026 prices. [BLS, 2025]
- A middle-income household spends about $64,240 a year on goods and services. Because prices are 11.2% above CBO’s 2021 forecast path, about $6,440 of that is the Biden-era increase above forecast.
- Its OBBBA tax cut against prior law is $1,160, so the Biden-era price increase costs it 5.6 times what the tax cut saves. For the fourth 20%, it is $8,290 against a $2,570 tax cut.
- Had the Biden-era increase not happened, the middle 20% would keep about $7,600 more a year: its $1,160 tax cut plus the $6,440 it would not be spending on the same purchases.
- Measured the same way, the Trump II gap so far costs that household about $790. That is less than ITEP’s $1,850, which uses ITEP’s own consumption model.
2026 spending = 2024 Consumer Expenditure Survey average annual expenditures minus personal insurance and pensions (payroll and retirement contributions, not consumer prices), raised by the CPI-U from its 2024 average to its January–September 2026 average. The Biden-era cost is the share of that spending due to prices being 11.15% above CBO’s February 2021 path. CE quintiles are by household income and do not match ITEP’s income ranges exactly, and the Top 20% tax cut is ITEP’s weighted average of its top three groups. Like ITEP’s figure, these measure a forecast miss, not the effect of any one policy.
| Term | Window | CBO forecast at start | Actual change | Prices above forecast | Per year |
|---|---|---|---|---|---|
| Biden | Q4 2020–Q4 2024 (16 quarters) | +9.09% (Feb 2021) | +21.25% | 11.15% | 2.68% |
| Trump II | Q4 2024–Q3 2026 (7 quarters) | +4.18% (Jan 2025) | +5.63% | 1.39% | 0.79% |
| Income group (CE quintile) | 2026 consumer spending | OBBBA tax cut vs. prior law | Biden-era above-forecast prices | Trump II above-forecast prices | Kept without Biden-era prices |
|---|---|---|---|---|---|
| Poorest 20% | $36,370 | −$20 | −$3,650 | −$450 | +$3,630 |
| Second 20% | $50,140 | +$370 | −$5,030 | −$620 | +$5,400 |
| Middle 20% | $64,240 | +$1,160 | −$6,440 | −$790 | +$7,600 |
| Fourth 20% | $82,650 | +$2,570 | −$8,290 | −$1,020 | +$10,860 |
| Top 20% | $130,340 | +$10,830 | −$13,080 | −$1,610 | +$23,910 |
| Income group | ITEP price cost, Trump II | Built before the war (by Q1 2026) | Built after the war began |
|---|---|---|---|
| Poorest 20% | +$530 | +$250 | +$280 |
| Second 20% | +$1,170 | +$540 | +$630 |
| Middle 20% | +$1,850 | +$860 | +$990 |
| Fourth 20% | +$2,760 | +$1,280 | +$1,480 |
| Next 15% | +$3,920 | +$1,820 | +$2,100 |
| Next 4% | +$5,700 | +$2,650 | +$3,050 |
| Richest 1% | +$15,990 | +$7,420 | +$8,570 |
Correcting the Graphic
What it gets right, what it leaves out, and a fair way to say it
ITEP is a left-leaning research group, and its arithmetic checks out: the three pieces add to the totals in the graphic. The problem is the headline. It says families are “paying more as a result of key Trump tax and economic policies,” but most of the added cost is prices measured against a forecast, and the tax piece leaves out the extensions that prevented a tax increase for nearly everyone.
| What the graphic says or implies | What the data show |
|---|---|
| “Every income group is paying more as a result of key Trump tax … policies” | Counting taxes alone against the law that would otherwise have applied, the OBBBA cuts taxes for six of seven groups; the middle 20% saves $1,160. The poorest 20% see +$20 (ITEP Fig. 6). |
| The tax piece is “new tax policies enacted as part of the OBBBA” | The graphic leaves out the OBBBA’s largest provision for working families: stopping the 2017 tax cuts from expiring. That alone saves the middle 20% $780 and the fourth 20% $1,500. |
| The health-credit loss is a Trump policy | The enhanced credit was written to expire on January 1, 2026, by the Inflation Reduction Act, which passed without a single Republican vote. The OBBBA did not change that date (CRS). |
| Households are “paying more” | Mostly prices: $2,260 of the $2,420 average added cost (93%). The price figure is measured against a CBO forecast, not against last year’s prices. |
| Higher prices are from Trump policies | About 54% of the above-forecast price gap built up after the Iran war began on February 28, 2026, much of it gasoline and energy. Tariffs did add some (about 0.8% to core PCE prices by Feb 2026, per a Federal Reserve note). |
| This is unusual | By the same test, prices ended the Biden term 11.2% above CBO’s forecast, versus 1.4% so far under Trump II, about 8 times as large. |
The richest 1% receive the largest tax cuts, about $28,550 a year in new provisions and $70,240 against prior law. And CBO’s analysis of the full law, which also counts spending changes such as Medicaid and SNAP, found the lowest-income tenth of households would lose resources on average over 2026–2034. That is a different question from the 2026 tax and price claim in the graphic, but it is part of a complete picture. [CBO, 2025b]
On taxes alone, measured against the law that would otherwise have applied, the OBBBA cuts 2026 federal taxes for six of seven income groups, including $1,160 for the middle 20%.Finding from ITEP’s own Figure 6, October 2026
The Bottom Line
What families are actually paying for in 2026
- Taxes: the OBBBA lowered 2026 federal taxes for most working families by keeping the 2017 tax cuts from expiring, and added new breaks for tips, overtime, car loans, and seniors.
- Health credit: the enhanced credit ended on the date written into the Inflation Reduction Act, which passed with only Democratic votes.
- Prices: prices are 1.4% above CBO’s January 2025 forecast, more than half of that from the 2026 energy shock. By the same test, the Biden term left prices 11.2% above forecast. That higher price level has not come down, and it costs a middle-income family about $6,440 in 2026, 5.6 times its tax cut. (See our companion report, Where Prices Went Up — and Why They Never Came Back Down.)
Families are right that things cost more. Most of that is the price level set from 2021 to 2024, plus the 2026 energy shock. Calling it the result of a tax law that cut most families’ taxes mixes up three different things. Keeping taxes low while bringing energy prices down is the path that actually helps household budgets.
Inspect the Data
Every number in this report, by source. Each table can be downloaded as a CSV.
| Income group | Income range | Avg. income | Prices above forecast | EPTC expiration | OBBBA new tax policies | Graphic total |
|---|---|---|---|---|---|---|
| Poorest 20% | $0–$23,500 | $12,900 | +$530 | +$130 | +$90 | +$750 |
| Second 20% | $23,500–$46,600 | $34,400 | +$1,170 | +$420 | $0 | +$1,590 |
| Middle 20% | $46,600–$80,100 | $62,000 | +$1,850 | +$230 | −$380 | +$1,700 |
| Fourth 20% | $80,100–$148,300 | $109,100 | +$2,760 | +$40 | −$1,070 | +$1,730 |
| Next 15% | $148,300–$360,000 | $217,700 | +$3,920 | $0 | −$2,230 | +$1,690 |
| Next 4% | $360,000–$960,600 | $539,500 | +$5,700 | $0 | −$4,580 | +$1,120 |
| Richest 1% | $960,600+ | $2,848,700 | +$15,990 | $0 | −$28,550 | −$12,560 |
| All households | $125,100 | +$2,260 | +$160 | −$1,070 | +$1,360 |
| Income group | Extensions of 2017 cuts | New OBBBA policies | Net vs. prior law | Plus EPTC expiration | Graphic’s tax figure |
|---|---|---|---|---|---|
| Poorest 20% | −$70 | +$90 | +$20 | +$150 | +$220 |
| Second 20% | −$370 | $0 | −$370 | +$50 | +$420 |
| Middle 20% | −$780 | −$380 | −$1,160 | −$930 | −$150 |
| Fourth 20% | −$1,500 | −$1,070 | −$2,570 | −$2,530 | −$1,030 |
| Next 15% | −$3,030 | −$2,230 | −$5,260 | −$5,260 | −$2,230 |
| Next 4% | −$12,300 | −$4,580 | −$16,880 | −$16,880 | −$4,580 |
| Richest 1% | −$41,690 | −$28,550 | −$70,240 | −$70,240 | −$28,550 |
| All households | −$1,900 | −$1,070 | −$2,970 | −$2,810 | −$910 |
| Quarter | Actual CPI-U (SA, avg.) | CBO Jan 2025 forecast | Actual change since Q4 2024 | Forecast change | Prices above forecast |
|---|---|---|---|---|---|
| Q4 2024 | 316.588 | 316.169 | +0.00% | +0.00% | 0.00% |
| Q1 2025 | 319.475 | 317.891 | +0.91% | +0.55% | 0.36% |
| Q2 2025 | 320.786 | 319.537 | +1.33% | +1.06% | 0.26% |
| Q3 2025 | 323.235 | 321.487 | +2.10% | +1.68% | 0.41% |
| Q4 2025 † | 325.547 | 323.556 | +2.83% | +2.34% | 0.48% |
| Q1 2026 | 328.114 | 325.581 | +3.64% | +2.98% | 0.65% |
| Q2 2026 | 332.985 | 327.493 | +5.18% | +3.58% | 1.54% |
| Q3 2026 | 334.414 | 329.398 | +5.63% | +4.18% | 1.39% |
| Term | Window | CBO forecast at start | Actual change | Prices above forecast | Per year |
|---|---|---|---|---|---|
| Biden | Q4 2020–Q4 2024 (16 quarters) | +9.09% (Feb 2021) | +21.25% | 11.15% | 2.68% |
| Trump II | Q4 2024–Q3 2026 (7 quarters) | +4.18% (Jan 2025) | +5.63% | 1.39% | 0.79% |
| Dataset | Source | File |
|---|---|---|
| ITEP components and provisions | ITEP report, Figures 5–7 | The-Impact-of-Key-Trump-Policies-on-Costs-and-Taxes-for-Americans.pdf |
| ITEP national and state shares | ITEP data download | US-and-state-estimates-download-for-Trump-Taxes-and-Costs.xlsx |
| CBO January 2025 forecast | US-CBO/cbo-data | quarterly_2025-01.csv |
| CBO February 2021 forecast | CBO Outlook, Table 2-1 | 56970-Outlook.pdf |
| CPI-U all items and less energy | BLS bulk files | cu.data series CUSR0000SA0, CUSR0000SA0LE |
References
Citations follow APA 7th Edition format. All data were downloaded from the publishing organization. ITEP’s figures are reported as published; the comparisons and illustrations are the author’s calculations.
Institute on Taxation and Economic Policy. (2026a, October). Impact of key Trump policies on taxes and costs: National and state estimates [Report]. https://itep.org/impact-of-trump-policies-on-taxes-and-consumer-costs-2026/
Source of the graphic (Figure 3) and the component breakdowns used here (Figures 5–7). The PDF version is at https://itep.org/wp-content/uploads/The-Impact-of-Key-Trump-Policies-on-Costs-and-Taxes-for-Americans.pdf.
Institute on Taxation and Economic Policy. (2026b). U.S. and state estimates download for Trump taxes and costs [Data set]. https://www.itep.org/wp-content/uploads/US-and-state-estimates-download-for-Trump-Taxes-and-Costs.xlsx
National and 50-state results as shares of income; used for the share-of-income chart and the Texas table. Downloaded October 18, 2026.
Congressional Budget Office. (2021). The budget and economic outlook: 2021 to 2031. https://www.cbo.gov/system/files/2021-02/56970-Outlook.pdf
Table 2-1: CPI-U forecast, fourth quarter to fourth quarter, made at the start of the Biden term.
Congressional Budget Office. (2025a). Economic projections, January 2025 (quarterly) [Data set]. US-CBO/cbo-data. https://github.com/US-CBO/cbo-data
CBO’s official open-data repository; file data/economic/economic_projections/quarterly_2025-01.csv, variable cpiu. This is the forecast ITEP compares against.
Congressional Budget Office. (2025b, August 11). Distributional effects of changes in taxes and spending under Public Law 119-21. https://www.cbo.gov/system/files/2025-08/61367-Distributional-Effects.pdf
Full-law distribution including spending changes, 2026–2034 average; cited for context in Section 6.
Congressional Research Service. (2026a). Enhanced premium tax credit and 2026 exchange premiums (R48290). https://www.congress.gov/crs-product/R48290
Documents the 2021–2022 creation, the 2023–2025 extension, the January 1, 2026 sunset, and that P.L. 119-21 did not affect the expiration.
Congressional Research Service. (2026b). U.S. military operations against Iran (IN12662). https://www.congress.gov/crs-product/IN12662
Start date of the Iran war, February 28, 2026.
Congress.gov. (2021). H.R.1319 — American Rescue Plan Act of 2021: All actions. https://www.congress.gov/bill/117th-congress/house-bill/1319/all-actions
Senate passage 50–49 (March 6, 2021); House agreement 220–211 (March 10, 2021); signed March 11, 2021 (P.L. 117-2).
Congress.gov. (2022). H.R.5376 — Inflation Reduction Act of 2022: All actions. https://www.congress.gov/bill/117th-congress/house-bill/5376/all-actions
Senate passage 51–50 (August 7, 2022); House agreement 220–207 (August 12, 2022); signed August 16, 2022 (P.L. 117-169).
Congress.gov. (2025). H.R.1 — One Big Beautiful Bill Act: All actions. https://www.congress.gov/bill/119th-congress/house-bill/1/all-actions
Senate passage 51–50 (July 1, 2025); House agreement 218–214 (July 3, 2025); signed July 4, 2025 (P.L. 119-21).
Office of the Clerk, U.S. House of Representatives. (2021). Roll call 72, H.R. 1319. https://clerk.house.gov/Votes/202172
American Rescue Plan Act final House vote, 220–211, no Republican yeas.
Office of the Clerk, U.S. House of Representatives. (2022). Roll call 420, H.R. 5376. https://clerk.house.gov/Votes/2022420
Inflation Reduction Act final House vote: Democrats 220–0, Republicans 0–207.
Internal Revenue Service. (n.d.). Questions and answers on the premium tax credit. https://www.irs.gov/affordable-care-act/individuals-and-families/questions-and-answers-on-the-premium-tax-credit
Confirms the temporary 2021–2025 expansion and that the underlying credit continues.
U.S. Bureau of Labor Statistics. (2025). Consumer Expenditure Surveys, 2024: Table 1101. Quintiles of income before taxes [Data set]. https://www.bls.gov/cex/tables/calendar-year/mean-item-share-average-standard-error/cu-income-quintiles-before-taxes-2024.xlsx
Average annual expenditures and personal insurance and pensions by income quintile; used to put dollar values on the forecast gaps in Section 5.
U.S. Bureau of Labor Statistics. (2026a). Consumer Price Index for All Urban Consumers (CPI-U): bulk time-series files [Data set]. https://download.bls.gov/pub/time.series/cu/
CPI-U all items and all items less energy, seasonally adjusted, through September 2026. October 2025 was not published.
Minton, R., et al. (2026, April 8). Detecting tariff effects on consumer prices in real time, Part II (FEDS Notes). Board of Governors of the Federal Reserve System. https://www.federalreserve.gov/econres/notes/feds-notes/detecting-tariff-effects-on-consumer-prices-in-real-time-part-II-20260408.html
Estimates 2025 tariffs added about 0.8% to core PCE prices through February 2026.