
Where Prices Went Up — and Why They Never Came Back Down: Inflation Under Trump, Biden, and Trump Again
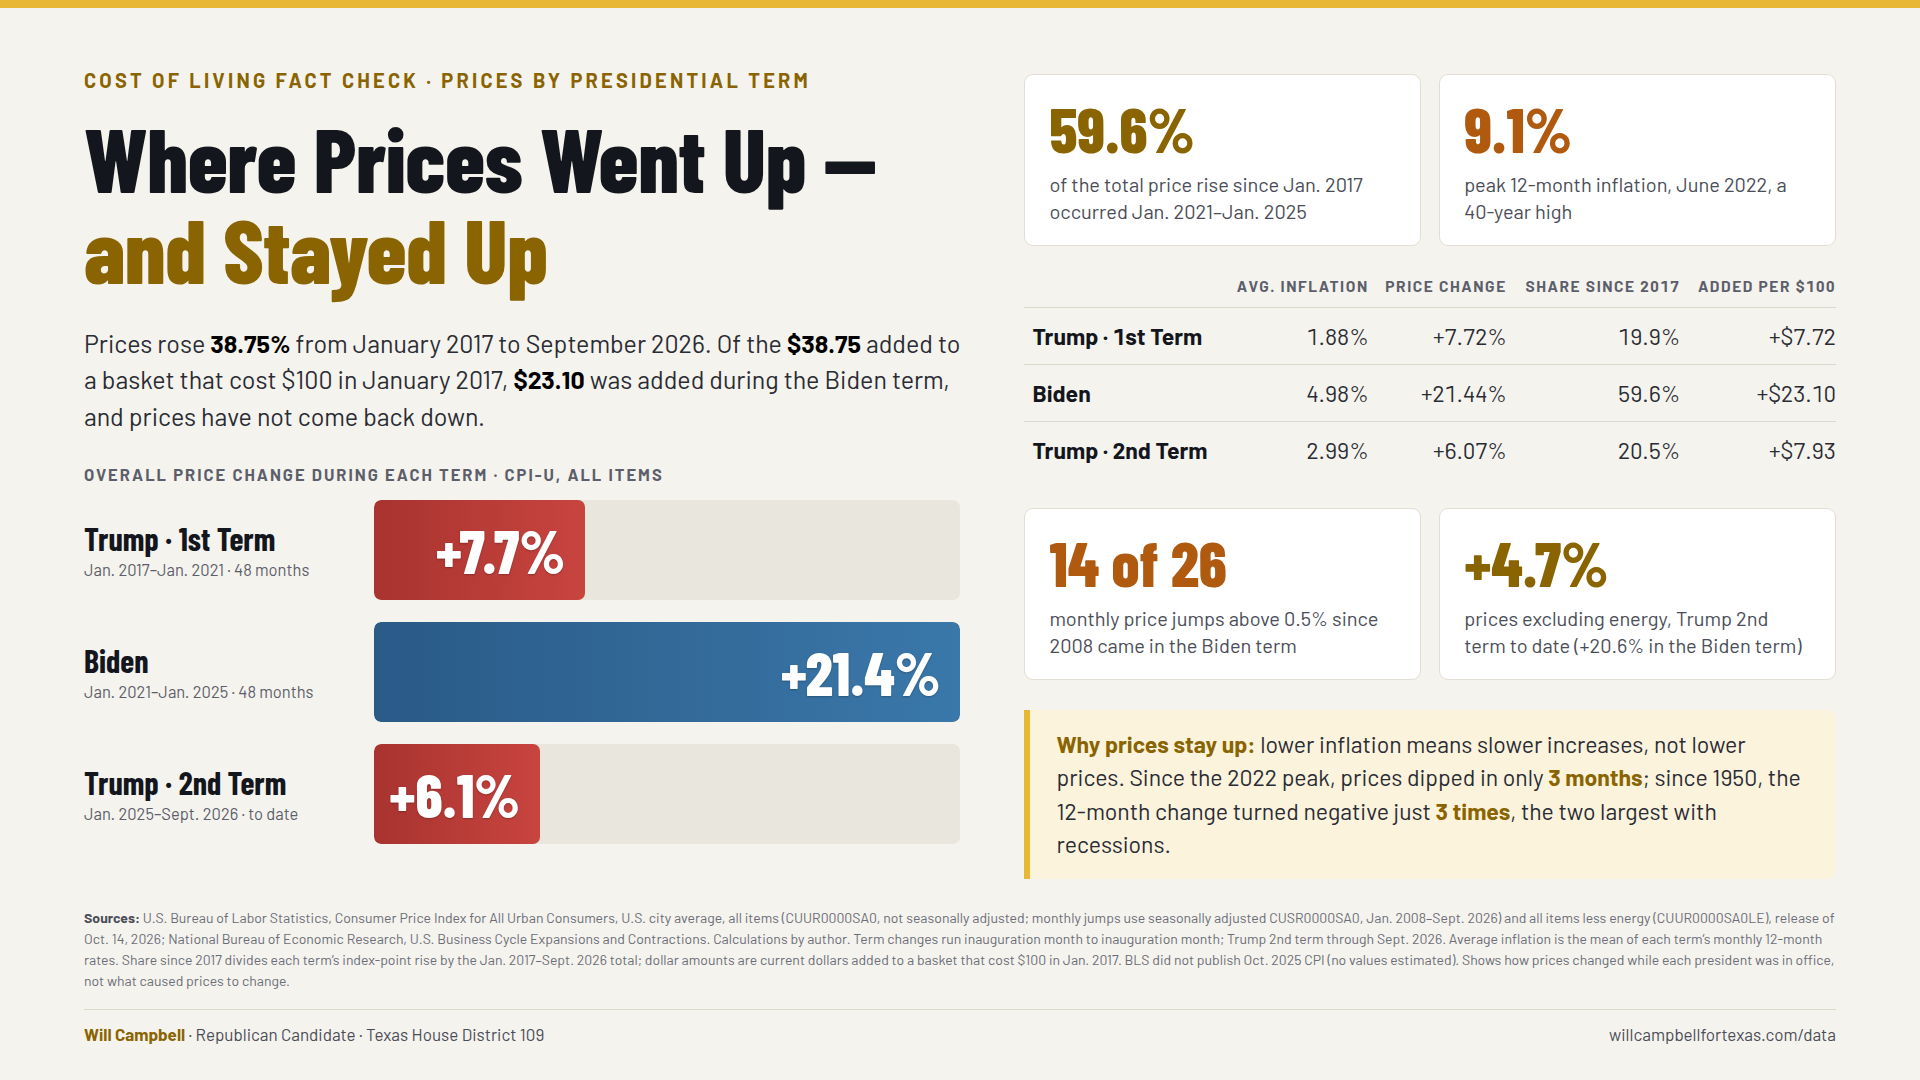
Where Prices Went Up — and Why They Never Came Back Down: Inflation Under Trump, Biden, and Trump Again
A viral graphic says average inflation was 1.9% under President Trump’s first term, 5.0% under President Biden, and 2.9% so far in Trump’s second term. Government data shows those numbers are right. This report goes further: month by month, it shows when prices actually rose, why they have not fallen back, how much of today’s price level was set between 2021 and 2024, and what prices would look like if those four years had gone differently.
Executive Summary
The key findings of this report at a glance
This report checks a viral inflation graphic against Bureau of Labor Statistics data, then follows prices month by month from 2008 through September 2026. The main findings: [BLS, 2026a]
- The graphic is accurate. Average 12-month inflation was 1.88% under Trump’s first term, 4.98% under Biden, and 2.94% under Trump’s second term through August 2026 (2.99% with September). Section 1
- The inflation rate is not the price level. An average rate tells you how fast prices climbed, not how high they climbed. A basket that cost $100 at 2016 prices cost $108.99 in January 2021, $132.36 in January 2025, and $140.39 in September 2026. Section 2
- The steepest increases came during the Biden term. Prices rose 21.4% from January 2021 to January 2025, and inflation peaked at 9.1% in June 2022. Of the 26 months since 2008 with price jumps above 0.5%, 14 fell in the Biden term, as did 9 of the 15 largest. Groceries rose 22.7% and gasoline 40.4%, and the pattern holds with gasoline taken out. Sections 3–4
- Most of the price increase since 2017 occurred under Biden. Prices rose 38.75% from January 2017 to September 2026. Of that increase, 59.6% came between January 2021 and January 2025, about three times the share of either Trump term, and about 40% came in the two years Democrats controlled both chambers of Congress. Section 9
- Both supply shocks and stimulus drove the surge. Federal Reserve research finds pandemic income support added about 3 percentage points to inflation by the end of 2021. The American Rescue Plan passed without a single Republican vote. The Inflation Reduction Act came after the peak and, by CBO’s estimate, had a negligible effect on inflation. [Jordà et al., 2022] [CBO, 2022] Section 5
- Prices have not come back down, and they rarely do. Since the 2022 peak, overall prices dipped in only 3 months, all by tiny amounts. Since 1950 the yearly price change has turned negative only three times, and the two larger episodes came with recessions. [NBER, 2023] Section 6
- Trump’s second term added a smaller increase, much of it from the Iran war. Inflation averaged 2.62% before the war began on February 28, 2026; gasoline then jumped 21.2% in March. Leaving out energy, prices are up 4.7% since January 2025, compared with 20.6% over the Biden term. [CRS, 2026] Section 7
- Without the Biden-era increase, prices would be 11% to 18% lower today. Keeping every actual change since January 2025, the $140.39 basket would cost $115.60 if prices had been frozen, $124.56 at the Trump I pace, or $125.13 at the Federal Reserve’s 2% target. These are hypothetical scenarios, not estimates of any one policy’s effect. Section 8
The data show when prices rose, not who caused every increase. They do show that most of today’s higher price level was set from 2021 to 2024, that the laws passed in those years did not bring it down, and that families are still paying it. Section 9
Checking the Graphic First
The numbers are accurate. Here is what they do and do not tell you.
The graphic circulating on social media, credited to MRC with “Source: bls.gov,” lists average inflation of 1.9% for Trump’s first term, 5.0% for Biden, and 2.9% for Trump’s second term. To test it, we downloaded the Consumer Price Index for All Urban Consumers (CPI-U) directly from the Bureau of Labor Statistics and averaged every monthly 12-month inflation reading in each term, counting each term from the first full month in office. [BLS, 2026a]
The result: Trump I averaged 1.88%, Biden averaged 4.98%, and Trump II averaged 2.94% using data available through August 2026, when the graphic was posted. Rounded to one decimal place, all three match. With September’s data, released October 14, Trump II now averages 2.99%, which rounds to 3.0%. [BLS, 2026b]
Accurate as published. Two clarifications matter. First, Trump’s second term is only 19 months old, so its average can still change. Second, an average inflation rate tells you how fast prices were climbing, not how high they climbed. That difference is the most important idea in this report, and it is explained in Section 2.
Averages can hide a lot, so the chart stack below also shows every individual month. Trump I readings stayed in a narrow band between 0.12% and 2.95%. Biden-term readings ranged from 1.68% to 9.06%, with 40-year highs in 2022. Trump II readings have ranged from 2.31% to 4.25%.
| Term | Months | Mean | Median | Low | High | Std. Dev. |
|---|---|---|---|---|---|---|
| Trump I (Feb 2017–Jan 2021) | 48 | 1.88% | 1.92% | 0.12% | 2.95% | 0.61 |
| Biden (Feb 2021–Jan 2025) | 48 | 4.98% | 4.55% | 1.68% | 9.06% | 2.17 |
| Trump II (Feb 2025–Sep 2026) | 19 | 2.99% | 2.82% | 2.31% | 4.25% | 0.57 |
Inflation Rate vs. Price Level: The Idea That Explains Everything
Lower inflation means prices are rising more slowly, not that they are falling.
The price level is what things cost today. The inflation rate is how fast that cost is rising, usually measured against the same month a year earlier. When inflation “comes down” from 9% to 3%, prices are still going up, just more slowly. The higher prices stay, and the new increases stack on top of them.
Think of a staircase. The inflation rate is the height of each new step. The price level is how high you have climbed. During 2021 and 2022 the steps were the tallest in 40 years, peaking at 9.1% in June 2022. The steps got shorter in 2023 and 2024, but the staircase never went back down. Every family that felt the jump at the grocery store or the gas pump is still standing on that higher step. [BLS, 2026a]
The second and third tabs below translate this into dollars. A basket of everyday goods and services that cost $100 at 2016 prices cost $101.18 when Trump took office in January 2017 and $108.99 when Biden took office in January 2021. It cost $132.36 when Biden left office in January 2025, and costs $140.39 as of September 2026. Put the other way, $100 today buys what $71.23 bought in 2016.
Where the Price Increases Actually Happened
Every month since January 2008, across five presidential terms
This is the most important chart in this report. It shows the month-to-month change in prices for every month from January 2008 through September 2026, using the seasonally adjusted CPI, which removes normal seasonal swings so months can be compared fairly. The bars are each month’s increase. The dark line is the cumulative price level that results. [BLS, 2026a]
Three things stand out:
- The tallest bars cluster in 2021 and 2022. Since 2008 there have been 26 months in which overall prices rose more than half a percent in a single month. 14 of them came during the Biden term, and the other 12 are spread across the other five terms, almost 15 years in all. Of the 15 largest monthly increases in the entire period, 9 happened under Biden.
- The price line bends sharply upward in 2021. Before 2021 the line climbs at a steady, gentle slope. From 2021 through 2022 it turns steeply upward, then resumes a gentler climb from a much higher starting point.
- The line essentially never goes down. Since the inflation peak in mid-2022 there have been only 3 months in which overall prices dipped at all: Jul 2022 (-0.01%), Jun 2024 (-0.04%), Jun 2026 (-0.42%). None came close to reversing the surge.
The “without gasoline” view leaves gasoline out of the chart so the smaller monthly changes in overall prices and food at home are easy to see. Gasoline swings 10% or 20% in a single month, which flattens everything else on the same scale. The “with gasoline” view adds gasoline in its own panel. The last two tabs total the change within each term and list the largest months.
| Term | All Items | Food at Home | Gasoline | All Items Less Energy |
|---|---|---|---|---|
| Bush 2008 | 0.0% | +6.6% | -43.2% | +2.4% |
| Obama I | +9.4% | +6.5% | +98.4% | +6.9% |
| Obama II | +4.9% | +1.6% | -32.7% | +7.4% |
| Trump I | +8.0% | +6.5% | +1.2% | +8.3% |
| Biden | +21.2% | +22.7% | +40.4% | +20.2% |
| Trump II* | +5.9% | +3.7% | +28.5% | +4.8% |
| Rank | Month | Term | All Items | Food at Home | Gasoline |
|---|---|---|---|---|---|
| 1 | June 2022 | Biden | +1.26% | +1.07% | +10.3% |
| 2 | March 2022 | Biden | +1.12% | +1.31% | +16.3% |
| 3 | June 2008 | Bush 2008 | +1.05% | +0.72% | +11.0% |
| 4 | October 2021 | Biden | +0.96% | +1.00% | +4.9% |
| 5 | May 2022 | Biden | +0.95% | +1.40% | +5.2% |
| 6 | March 2026 | Trump II | +0.87% | -0.16% | +21.2% |
| 7 | November 2021 | Biden | +0.86% | +0.90% | +6.5% |
| 8 | June 2021 | Biden | +0.85% | +0.79% | +2.8% |
| 9 | June 2009 | Obama I | +0.83% | -0.05% | +20.3% |
| 10 | July 2008 | Bush 2008 | +0.71% | +1.26% | +3.9% |
| 11 | February 2022 | Biden | +0.69% | +1.31% | +3.3% |
| 12 | December 2021 | Biden | +0.69% | +0.57% | +2.8% |
| 13 | May 2021 | Biden | +0.66% | +0.36% | +1.4% |
| 14 | September 2026 | Trump II | +0.65% | -0.07% | +9.1% |
| 15 | April 2026 | Trump II | +0.64% | +0.68% | +5.4% |
| Term | Months | Avg. All Items | Avg. Food at Home | Months > 0.5% | Months < 0 | Largest |
|---|---|---|---|---|---|---|
| Bush 2008 | 12 | 0.00% | 0.54% | 3 | 4 | 1.05% |
| Obama I | 48 | 0.19% | 0.13% | 3 | 9 | 0.83% |
| Obama II | 48 | 0.10% | 0.03% | 1 | 13 | 0.54% |
| Trump I | 48 | 0.16% | 0.13% | 2 | 8 | 0.51% |
| Biden | 48 | 0.40% | 0.43% | 14 | 2 | 1.26% |
| Trump II | 19 | 0.29% | 0.20% | 3 | 1 | 0.87% |
Zooming In: The Pandemic Era and the Last Two Years
The same data rebased to December 2019 and December 2023, with and without gasoline
Zooming in makes the timing clearer. With prices set to 100 in December 2019, overall prices were only about 1% higher at the end of 2020. From there it rose almost continuously, and the steepest part of the climb came from the spring of 2021 through the summer of 2022. Food at home rose even faster than overall prices. By September 2026 overall prices were about 30% above their December 2019 level and food at home about 32% above. [BLS, 2026a]
Gasoline tells a different story. It is the most volatile thing households buy. It collapsed in spring 2020, soared to about $5.06 a gallon in June 2022, the highest in the BLS series, and drifted down to around $3 by early 2026, before the Iran war pushed it back up (see Section 7). Showing it in its own view keeps its swings from hiding the steady climb in everything else. [BLS, 2026c]
The 2024–2026 view shows what has happened since. Overall prices kept rising at a slower, steadier pace through 2024 and 2025. In spring 2026 gasoline jumped and overall prices rose faster for a few months. Food at home has been nearly flat since spring 2026.
What Drove the 2021–2022 Surge
What the research shows, and what the data can and cannot prove
No single cause produced the surge, and honest analysis has to say so. The research most often cited, including work by economists at the Federal Reserve, points to several forces acting together:
- Government spending and relief checks. Researchers at the Federal Reserve Bank of San Francisco estimated that U.S. pandemic income-support measures added about 3 percentage points to U.S. inflation by the end of 2021. That is a major reason U.S. inflation ran higher than in other wealthy countries. [Jordà et al., 2022] The largest of these measures, the $1.9 trillion American Rescue Plan with its $1,400-per-person checks, was signed in March 2021. It passed the House 220–211 without a single Republican vote and the Senate 50–49. [Congress.gov, 2021] [House Clerk, 2021]
- Supply shocks. Shipping bottlenecks, factory shutdowns, and the shift in spending from services to goods pushed prices up directly. A San Francisco Fed analysis attributed roughly half of the run-up to supply factors and about one-third to demand. [Shapiro, 2022]
- Energy and the war in Ukraine. Russia’s February 2022 invasion sent energy and food commodity prices soaring. Energy prices were up 41.6% from a year earlier in June 2022. [BLS, 2026a]
- A tight labor market. Former Fed Chair Ben Bernanke and Olivier Blanchard found that most of the 2021–2022 rise came from price shocks. They also found that fiscal policy added to it by boosting demand for goods already in short supply, and that tight labor markets became a bigger factor as the other shocks faded. [Bernanke & Blanchard, 2023]
The charts show when prices rose. Timing alone cannot assign an exact share of the increase to any one president, law, or event. Some relief spending began under President Trump in 2020: the CARES Act’s $1,200 checks and December 2020’s $600 checks. The Federal Reserve, not the president, sets interest rates. What the record does show is that the largest stimulus, passed in early 2021, came right before the steepest climb in prices, and that research credits that spending with a meaningful part of the increase.
One more fact matters for anyone weighing the record. The 2022 law branded the “Inflation Reduction Act” was signed in August 2022, two months after inflation had already peaked. The Congressional Budget Office concluded it would have a “negligible effect on inflation” in 2022 and an effect of no more than 0.1 percentage point either way in 2023. [CBO, 2022] Inflation did come down after mid-2022 as supply chains healed, energy prices fell back, and the Federal Reserve raised interest rates. But nothing passed in Washington brought prices back down to where they had been.
Why Prices Don’t Come Back Down
More than a century of price data shows falling prices are rare, and they usually come with a recession.
Many people expect that once inflation “is beaten,” prices will return to where they were. History says otherwise. We checked every month of CPI data back to 1913 against the official recession dates kept by the National Bureau of Economic Research. [BLS, 2026a] [NBER, 2023]
Since 1950, the 12-month change in consumer prices has turned negative only three times. In 1954–55 it happened just after a recession (low of −0.7%). In 2009 it happened during the Great Recession (low of −2.1%). In 2015 it was a brief dip to −0.2% caused by an oil-price collapse. Average prices for a full year have fallen only three times since 1940: in 1949, 1955, and 2009, each tied to a recession. The deep price declines of the 1920s and 1930s came with depressions.
There is a reason. Wages, rents, contracts, and business costs adjust upward over time and rarely reverse. Falling prices across the whole economy usually happen only when demand collapses: when people lose jobs, businesses close, and spending dries up. That is a recession, and no family wants that cure. Since the 2022 peak, the economy has avoided recession, and as Section 3 showed, overall prices have dipped in only 3 months, all of them tiny.
The price increases of 2021 and 2022 were not a temporary spike that will reverse. Without a recession, a higher price level is the new floor, and every later increase is added on top of it.Finding from BLS CPI data, 1913–2026
| Period | Months | Lowest 12-Mo Change | Recession-Linked? | Context |
|---|---|---|---|---|
| Aug 1915–Sep 1915 | 2 | -0.98% | Yes | After 1913–14 recession |
| Jan 1921–Feb 1923 | 26 | -15.79% | Yes | Depression of 1920–21 |
| Jul 1924–Nov 1924 | 5 | -0.58% | Yes | 1923–24 recession |
| Jul 1926–Aug 1928 | 26 | -3.35% | Yes | 1926–27 recession |
| Oct 1928–Jan 1929 | 4 | -1.16% | Yes | Post-1927 recession |
| Mar 1929–May 1929 | 3 | -1.17% | No | Months before 1929 crash |
| Feb 1930–Mar 1930 | 2 | -0.59% | Yes | Great Depression |
| May 1930–Oct 1933 | 42 | -10.74% | Yes | Great Depression |
| Apr 1936–May 1936 | 2 | -0.72% | No | Mid-Depression |
| Mar 1938–Aug 1939 | 18 | -4.11% | Yes | 1937–38 recession |
| Jan 1940–Jan 1940 | 1 | -0.71% | No | Late Depression |
| Sep 1940–Sep 1940 | 1 | -0.71% | No | Late Depression |
| May 1949–Jun 1950 | 14 | -2.87% | Yes | 1948–49 recession |
| Sep 1954–Aug 1955 | 12 | -0.74% | Yes | Just after 1953–54 recession |
| Mar 2009–Oct 2009 | 8 | -2.10% | Yes | Great Recession |
| Jan 2015–May 2015 | 5 | -0.20% | No | Oil-price collapse (no recession) |
| Sep 2015–Sep 2015 | 1 | -0.04% | No | Oil-price collapse (no recession) |
Trump’s Second Term and the Iran War Energy Shock
What has changed since January 2025, with and without energy
From January 2025 through September 2026, overall prices rose 6.1%, against 21.4% during the four Biden years. For the first year of the term, from February 2025 through February 2026, 12-month inflation averaged 2.62%. Gasoline was cheaper in February 2026 (about $3.06 a gallon) than in January 2025 (about $3.21). [BLS, 2026a] [BLS, 2026c]
Then came the war. The United States and Israel launched military operations against Iran on February 28, 2026, [CRS, 2026] and oil shipments through the Strait of Hormuz fell sharply. [EIA, 2026a] Gasoline prices jumped 21.2% in March alone, and the average gallon reached about $4.65 in May 2026. The United States and Iran signed an agreement on June 18, 2026, to end the conflict, but energy prices have stayed elevated. [EIA, 2026b] By September 2026, energy prices were up 20.4% from a year earlier and overall inflation was 3.7%. [BLS, 2026b]
BLS publishes an index of all items less energy, which removes gasoline and household energy. On that measure, prices rose 20.6% from January 2021 to January 2025 and 4.7% from January 2025 to September 2026. In September 2026 that measure was up 2.6% over the year. Most of the recent jump in headline inflation is energy, and energy is tied to the Iran war. Prices outside energy are still rising faster than the Fed’s 2% goal, and Federal Reserve economists estimate the 2025 tariffs added about 0.8% to core consumer prices through February 2026. That increase has been far smaller than the 2021–2024 run-up. [BLS, 2026a] [Minton et al., 2026]
What If the Biden-Era Increase Had Not Happened?
Three scenarios for what prices would cost today
To measure the size of what happened from 2021 through 2024, we asked a simple question: what would prices be today if those four years had gone differently? The method is straightforward. We start from the actual price level in January 2021. We replace the actual change from January 2021 to January 2025 with an assumed rate. Then we apply the actual price change that has happened since January 2025, including the Iran war energy shock, so the Trump II period is left exactly as it happened. [BLS, 2026a]
- Prices frozen. No price change at all for four years. This is a mathematical outer limit, not a realistic outcome.
- Trump I pace. Prices keep rising at Trump’s first-term average of 1.88% a year.
- Fed target. Prices rise at the Federal Reserve’s 2% goal.
The basket that actually costs $140.39 today (from $100 at 2016 prices) would cost $115.60 under the frozen-prices scenario, $124.56 at the Trump I pace, and $125.13 at the Fed’s target. Even in the two realistic scenarios, prices today would be about 11% lower than they are. Translated to the pump, regular gasoline at about $4.48 today would be about $3.21 at the Trump I pace. Ground beef at $6.79 a pound would be about $5.42.
This is a “what if,” not a measurement of blame. Replacing those four years also removes the pandemic reopening, global supply shocks, and Russia’s invasion of Ukraine, which no president controlled. It shows how much of today’s price level was set during those four years: roughly 74% of the total price increase since January 2021.
| Item | Actual | Frozen | Own Trump I Trend | Fed 2% | Trump I Trend Rate |
|---|---|---|---|---|---|
| Regular gasoline, per gallon | $4.48 | $3.25 | $3.21 | $3.51 | -0.3% |
| White bread, per pound | $1.83 | $1.47 | $1.68 | $1.59 | +3.4% |
| Ground beef, per pound | $6.79 | $4.86 | $5.42 | $5.26 | +2.8% |
| Whole milk, per gallon | $4.11 | $3.54 | $3.70 | $3.83 | +1.1% |
| Scenario | Assumed Rate | CPI Jan 2025 | CPI Sep 2026 | $100 Basket, Sep 2026 | vs. Actual |
|---|---|---|---|---|---|
| Actual (BLS) | — | 317.67 | 336.94 | $140.39 | — |
| Zero growth Feb 2021–Jan 2025 | 0.00% | 261.58 | 277.45 | $115.60 | -17.7% |
| Trump I average (1.88%/yr) | 1.88% | 281.85 | 298.94 | $124.56 | -11.3% |
| Fed 2% target | 2.00% | 283.14 | 300.32 | $125.13 | -10.9% |
The Bottom Line
Who set today’s prices, and what a fair comparison looks like
The graphic is accurate: inflation averaged about 1.9% under Trump’s first term, 5.0% under Biden, and about 2.9% so far in Trump’s second term. The fuller record says even more:
- Most of the price increase happened during the Biden term. Prices rose 21.4% from January 2021 to January 2025, about 74% of the total increase since Biden took office. Measured from the start of Trump’s first term, those four years account for 59.6% of the entire increase through September 2026. Fourteen of the 26 months since 2008 with price jumps above half a percent fell in his term.
- Those prices stayed. Outside of a recession, prices almost never fall. The higher price level set in 2021–2022 is the floor that every family still pays today.
- The policies passed in those years did not bring prices down. Federal Reserve research links the 2021 stimulus to part of the surge. The Inflation Reduction Act came after the peak and, by CBO’s own estimate, had a negligible effect on inflation.
- Trump’s second term added a much smaller increase. Prices rose 6.1% through September 2026, and most of the 2026 rise traces to the energy shock from the Iran war.
How Much of the Increase Since 2017 Came During the Biden Term?
A broader way to ask the question: of all the price growth since Trump first took office in January 2017, how much happened during the Biden term? Prices rose 38.75% from January 2017 to September 2026. Of that increase, 59.6% occurred between January 2021 and January 2025, about three times the share of either Trump term (19.9% for Trump I and 20.5% so far for Trump II). [BLS, 2026a]
In dollars: a basket that cost $100 in January 2017 costs $138.75 today. Of that $38.75 increase, $23.10 was added during the Biden term, compared with $7.72 under Trump I and $7.93 so far under Trump II.
The first two years were the steepest. Democrats controlled both the House and the Senate from January 2021 to January 2023, the Congress that passed the American Rescue Plan. Prices rose 14.4% in those two years alone. That is about 40% of the entire increase since 2017, and two-thirds of the Biden-term increase.
| Period | Dates | Start CPI | End CPI | Change in Period | Index Points | Share of Total Rise | Added per $100 (Jan 2017) |
|---|---|---|---|---|---|---|---|
| Trump I | Jan 2017–Jan 2021 | 242.839 | 261.582 | +7.72% | 18.743 | 19.9% | $7.72 |
| Biden | Jan 2021–Jan 2025 | 261.582 | 317.671 | +21.44% | 56.089 | 59.6% | $23.10 |
| Democratic House and Senate (117th Congress) | Jan 2021–Jan 2023 | 261.582 | 299.170 | +14.37% | 37.588 | 39.9% | $15.48 |
| Divided Congress (118th Congress) | Jan 2023–Jan 2025 | 299.170 | 317.671 | +6.18% | 18.501 | 19.7% | $7.62 |
| Trump II (to date) | Jan 2025–Sep 2026 | 317.671 | 336.940 | +6.07% | 19.269 | 20.5% | $7.93 |
| Total | Jan 2017–Sep 2026 | 242.839 | 336.940 | +38.75% | 94.101 | 100% | $38.75 |
These shares measure when prices rose, not who caused each increase. As Section 5 showed, supply shocks, the war in Ukraine, and 2020 relief spending signed by President Trump also fed the surge. But for anyone weighing responsibility for today’s prices, the timing is clear: most of the increase since 2017 came during the Biden term, the largest part of it while Democrats controlled Congress, and the laws passed in those years did not bring prices back down.
It is fair to ask any president what he is doing about prices. But blaming today’s price level on the current administration while leaving out the four years in which most of it was set is not a fair reading of the data. The numbers do not let anyone pin an exact share of the surge on one person or one law; supply shocks and a war in Europe played large roles. They do show that the steepest increases came during the Biden term, that the laws passed in that period did not lower prices, and that families are still living with the result.
Every number in this article can be checked. The data tables below hold the monthly figures, and each chart can be downloaded. The original BLS series are listed in the references.
Inspect the Data
The underlying data behind every chart, one tab per dataset. Each table can be downloaded as a CSV.
| Month | CPI-U | Headline 12-Mo % | Core 12-Mo % | Energy 12-Mo % | $100 (2016) Basket | Term |
|---|---|---|---|---|---|---|
| 2016-01 | 236.916 | 1.37 | 2.21 | -6.46 | 98.71 | Pre-term 2015-16 |
| 2016-02 | 237.111 | 1.02 | 2.33 | -12.48 | 98.79 | Pre-term 2015-16 |
| 2016-03 | 238.132 | 0.85 | 2.19 | -12.56 | 99.22 | Pre-term 2015-16 |
| 2016-04 | 239.261 | 1.13 | 2.15 | -8.87 | 99.69 | Pre-term 2015-16 |
| 2016-05 | 240.229 | 1.02 | 2.24 | -10.10 | 100.09 | Pre-term 2015-16 |
| 2016-06 | 241.018 | 1.00 | 2.24 | -9.43 | 100.42 | Pre-term 2015-16 |
| 2016-07 | 240.628 | 0.83 | 2.19 | -10.88 | 100.26 | Pre-term 2015-16 |
| 2016-08 | 240.849 | 1.06 | 2.32 | -9.25 | 100.35 | Pre-term 2015-16 |
| 2016-09 | 241.428 | 1.46 | 2.21 | -2.87 | 100.59 | Pre-term 2015-16 |
| 2016-10 | 241.729 | 1.64 | 2.14 | 0.15 | 100.72 | Pre-term 2015-16 |
| 2016-11 | 241.353 | 1.69 | 2.11 | 1.13 | 100.56 | Pre-term 2015-16 |
| 2016-12 | 241.432 | 2.07 | 2.20 | 5.41 | 100.59 | Pre-term 2015-16 |
| 2017-01 | 242.839 | 2.50 | 2.27 | 10.79 | 101.18 | Pre-term 2015-16 |
| 2017-02 | 243.603 | 2.74 | 2.22 | 15.19 | 101.50 | Trump I |
| 2017-03 | 243.801 | 2.38 | 2.00 | 10.94 | 101.58 | Trump I |
| 2017-04 | 244.524 | 2.20 | 1.88 | 9.27 | 101.88 | Trump I |
| 2017-05 | 244.733 | 1.87 | 1.73 | 5.43 | 101.97 | Trump I |
| 2017-06 | 244.955 | 1.63 | 1.70 | 2.31 | 102.06 | Trump I |
| 2017-07 | 244.786 | 1.73 | 1.69 | 3.38 | 101.99 | Trump I |
| 2017-08 | 245.519 | 1.94 | 1.68 | 6.39 | 102.30 | Trump I |
| 2017-09 | 246.819 | 2.23 | 1.69 | 10.14 | 102.84 | Trump I |
| 2017-10 | 246.663 | 2.04 | 1.77 | 6.42 | 102.77 | Trump I |
| 2017-11 | 246.669 | 2.20 | 1.71 | 9.39 | 102.78 | Trump I |
| 2017-12 | 246.524 | 2.11 | 1.78 | 6.88 | 102.72 | Trump I |
| 2018-01 | 247.867 | 2.07 | 1.82 | 5.54 | 103.27 | Trump I |
| 2018-02 | 248.991 | 2.21 | 1.85 | 7.73 | 103.74 | Trump I |
| 2018-03 | 249.554 | 2.36 | 2.12 | 7.03 | 103.98 | Trump I |
| 2018-04 | 250.546 | 2.46 | 2.14 | 7.87 | 104.39 | Trump I |
| 2018-05 | 251.588 | 2.80 | 2.24 | 11.66 | 104.83 | Trump I |
| 2018-06 | 251.989 | 2.87 | 2.26 | 11.97 | 104.99 | Trump I |
| 2018-07 | 252.006 | 2.95 | 2.35 | 12.12 | 105.00 | Trump I |
| 2018-08 | 252.146 | 2.70 | 2.20 | 10.22 | 105.06 | Trump I |
| 2018-09 | 252.439 | 2.28 | 2.17 | 4.85 | 105.18 | Trump I |
| 2018-10 | 252.885 | 2.52 | 2.14 | 8.91 | 105.37 | Trump I |
| 2018-11 | 252.038 | 2.18 | 2.21 | 3.12 | 105.01 | Trump I |
| 2018-12 | 251.233 | 1.91 | 2.18 | -0.34 | 104.68 | Trump I |
| 2019-01 | 251.712 | 1.55 | 2.15 | -4.79 | 104.88 | Trump I |
| 2019-02 | 252.776 | 1.52 | 2.08 | -5.05 | 105.32 | Trump I |
| 2019-03 | 254.202 | 1.86 | 2.04 | -0.39 | 105.91 | Trump I |
| 2019-04 | 255.548 | 2.00 | 2.06 | 1.68 | 106.48 | Trump I |
| 2019-05 | 256.092 | 1.79 | 1.99 | -0.46 | 106.70 | Trump I |
| 2019-06 | 256.143 | 1.65 | 2.13 | -3.39 | 106.72 | Trump I |
| 2019-07 | 256.571 | 1.81 | 2.21 | -2.03 | 106.90 | Trump I |
| 2019-08 | 256.558 | 1.75 | 2.39 | -4.39 | 106.90 | Trump I |
| 2019-09 | 256.759 | 1.71 | 2.36 | -4.75 | 106.98 | Trump I |
| 2019-10 | 257.346 | 1.76 | 2.31 | -4.17 | 107.22 | Trump I |
| 2019-11 | 257.208 | 2.05 | 2.32 | -0.59 | 107.17 | Trump I |
| 2019-12 | 256.974 | 2.29 | 2.26 | 3.44 | 107.07 | Trump I |
| 2020-01 | 257.971 | 2.49 | 2.26 | 6.22 | 107.48 | Trump I |
| 2020-02 | 258.678 | 2.33 | 2.36 | 2.77 | 107.78 | Trump I |
| 2020-03 | 258.115 | 1.54 | 2.09 | -5.74 | 107.54 | Trump I |
| 2020-04 | 256.389 | 0.33 | 1.43 | -17.72 | 106.83 | Trump I |
| 2020-05 | 256.394 | 0.12 | 1.22 | -18.91 | 106.83 | Trump I |
| 2020-06 | 257.797 | 0.65 | 1.19 | -12.65 | 107.41 | Trump I |
| 2020-07 | 259.101 | 0.99 | 1.57 | -11.16 | 107.96 | Trump I |
| 2020-08 | 259.918 | 1.31 | 1.74 | -9.04 | 108.30 | Trump I |
| 2020-09 | 260.280 | 1.37 | 1.71 | -7.69 | 108.45 | Trump I |
| 2020-10 | 260.388 | 1.18 | 1.61 | -9.19 | 108.49 | Trump I |
| 2020-11 | 260.229 | 1.17 | 1.65 | -9.43 | 108.43 | Trump I |
| 2020-12 | 260.474 | 1.36 | 1.62 | -6.96 | 108.53 | Trump I |
| 2021-01 | 261.582 | 1.40 | 1.41 | -3.65 | 108.99 | Trump I |
| 2021-02 | 263.014 | 1.68 | 1.28 | 2.36 | 109.59 | Biden |
| 2021-03 | 264.877 | 2.62 | 1.65 | 13.17 | 110.36 | Biden |
| 2021-04 | 267.054 | 4.16 | 2.96 | 25.14 | 111.27 | Biden |
| 2021-05 | 269.195 | 4.99 | 3.80 | 28.55 | 112.16 | Biden |
| 2021-06 | 271.696 | 5.39 | 4.47 | 24.48 | 113.20 | Biden |
| 2021-07 | 273.003 | 5.37 | 4.27 | 23.85 | 113.75 | Biden |
| 2021-08 | 273.567 | 5.25 | 4.00 | 24.97 | 113.98 | Biden |
| 2021-09 | 274.310 | 5.39 | 4.03 | 24.83 | 114.29 | Biden |
| 2021-10 | 276.589 | 6.22 | 4.56 | 29.97 | 115.24 | Biden |
| 2021-11 | 277.948 | 6.81 | 4.93 | 33.29 | 115.81 | Biden |
| 2021-12 | 278.802 | 7.04 | 5.45 | 29.30 | 116.16 | Biden |
| 2022-01 | 281.148 | 7.48 | 6.02 | 26.98 | 117.14 | Biden |
| 2022-02 | 283.716 | 7.87 | 6.41 | 25.55 | 118.21 | Biden |
| 2022-03 | 287.504 | 8.54 | 6.47 | 32.05 | 119.79 | Biden |
| 2022-04 | 289.109 | 8.26 | 6.16 | 30.27 | 120.46 | Biden |
| 2022-05 | 292.296 | 8.58 | 6.02 | 34.60 | 121.79 | Biden |
| 2022-06 | 296.311 | 9.06 | 5.92 | 41.62 | 123.46 | Biden |
| 2022-07 | 296.276 | 8.52 | 5.91 | 32.93 | 123.44 | Biden |
| 2022-08 | 296.171 | 8.26 | 6.32 | 23.81 | 123.40 | Biden |
| 2022-09 | 296.808 | 8.20 | 6.63 | 19.79 | 123.67 | Biden |
| 2022-10 | 298.012 | 7.75 | 6.28 | 17.63 | 124.17 | Biden |
| 2022-11 | 297.711 | 7.11 | 5.96 | 13.07 | 124.04 | Biden |
| 2022-12 | 296.797 | 6.45 | 5.71 | 7.31 | 123.66 | Biden |
| 2023-01 | 299.170 | 6.41 | 5.58 | 8.70 | 124.65 | Biden |
| 2023-02 | 300.840 | 6.04 | 5.54 | 5.19 | 125.35 | Biden |
| 2023-03 | 301.836 | 4.98 | 5.59 | -6.42 | 125.76 | Biden |
| 2023-04 | 303.363 | 4.93 | 5.52 | -5.06 | 126.40 | Biden |
| 2023-05 | 304.127 | 4.05 | 5.33 | -11.66 | 126.72 | Biden |
| 2023-06 | 305.109 | 2.97 | 4.83 | -16.74 | 127.12 | Biden |
| 2023-07 | 305.691 | 3.18 | 4.65 | -12.47 | 127.37 | Biden |
| 2023-08 | 307.026 | 3.67 | 4.35 | -3.62 | 127.92 | Biden |
| 2023-09 | 307.789 | 3.70 | 4.15 | -0.45 | 128.24 | Biden |
| 2023-10 | 307.671 | 3.24 | 4.03 | -4.53 | 128.19 | Biden |
| 2023-11 | 307.051 | 3.14 | 4.01 | -5.44 | 127.93 | Biden |
| 2023-12 | 306.746 | 3.35 | 3.93 | -2.02 | 127.81 | Biden |
| 2024-01 | 308.417 | 3.09 | 3.86 | -4.56 | 128.50 | Biden |
| 2024-02 | 310.326 | 3.15 | 3.75 | -1.90 | 129.30 | Biden |
| 2024-03 | 312.332 | 3.48 | 3.80 | 2.12 | 130.13 | Biden |
| 2024-04 | 313.548 | 3.36 | 3.61 | 2.61 | 130.64 | Biden |
| 2024-05 | 314.069 | 3.27 | 3.42 | 3.69 | 130.86 | Biden |
| 2024-06 | 314.175 | 2.97 | 3.27 | 0.99 | 130.90 | Biden |
| 2024-07 | 314.540 | 2.89 | 3.17 | 1.07 | 131.05 | Biden |
| 2024-08 | 314.796 | 2.53 | 3.20 | -3.98 | 131.16 | Biden |
| 2024-09 | 315.301 | 2.44 | 3.31 | -6.85 | 131.37 | Biden |
| 2024-10 | 315.664 | 2.60 | 3.33 | -4.86 | 131.52 | Biden |
| 2024-11 | 315.493 | 2.75 | 3.32 | -3.18 | 131.45 | Biden |
| 2024-12 | 315.605 | 2.89 | 3.24 | -0.52 | 131.50 | Biden |
| 2025-01 | 317.671 | 3.00 | 3.26 | 0.97 | 132.36 | Biden |
| 2025-02 | 319.082 | 2.82 | 3.12 | -0.17 | 132.95 | Trump II |
| 2025-03 | 319.799 | 2.39 | 2.79 | -3.25 | 133.25 | Trump II |
| 2025-04 | 320.795 | 2.31 | 2.78 | -3.74 | 133.66 | Trump II |
| 2025-05 | 321.465 | 2.35 | 2.79 | -3.46 | 133.94 | Trump II |
| 2025-06 | 322.561 | 2.67 | 2.93 | -0.83 | 134.40 | Trump II |
| 2025-07 | 323.048 | 2.70 | 3.06 | -1.55 | 134.60 | Trump II |
| 2025-08 | 323.976 | 2.92 | 3.11 | 0.22 | 134.99 | Trump II |
| 2025-09 | 324.800 | 3.01 | 3.02 | 2.85 | 135.33 | Trump II |
| 2025-10 | Trump II | |||||
| 2025-11 | 324.122 | 2.74 | 2.63 | 4.24 | 135.05 | Trump II |
| 2025-12 | 324.054 | 2.68 | 2.64 | 2.30 | 135.02 | Trump II |
| 2026-01 | 325.252 | 2.39 | 2.50 | -0.14 | 135.52 | Trump II |
| 2026-02 | 326.785 | 2.41 | 2.46 | 0.48 | 136.16 | Trump II |
| 2026-03 | 330.213 | 3.26 | 2.60 | 12.53 | 137.58 | Trump II |
| 2026-04 | 333.020 | 3.81 | 2.75 | 17.87 | 138.75 | Trump II |
| 2026-05 | 335.123 | 4.25 | 2.85 | 23.54 | 139.63 | Trump II |
| 2026-06 | 333.952 | 3.53 | 2.59 | 15.70 | 139.14 | Trump II |
| 2026-07 | 333.918 | 3.36 | 2.48 | 14.73 | 139.13 | Trump II |
| 2026-08 | 334.980 | 3.40 | 2.45 | 16.28 | 139.57 | Trump II |
| 2026-09 | 336.940 | 3.74 | 2.56 | 20.45 | 140.39 | Trump II |
| Month | All Items | Food at Home | Gasoline | All Items MoM % | Food MoM % | Gas MoM % |
|---|---|---|---|---|---|---|
| 2007-12 | 211.445 | 205.503 | 271.805 | |||
| 2008-01 | 212.174 | 207.100 | 273.485 | 0.34 | 0.78 | 0.62 |
| 2008-02 | 212.687 | 207.854 | 277.120 | 0.24 | 0.36 | 1.33 |
| 2008-03 | 213.448 | 208.093 | 279.234 | 0.36 | 0.11 | 0.76 |
| 2008-04 | 213.942 | 210.897 | 276.563 | 0.23 | 1.35 | -0.96 |
| 2008-05 | 215.208 | 211.800 | 289.883 | 0.59 | 0.43 | 4.82 |
| 2008-06 | 217.463 | 213.331 | 321.643 | 1.05 | 0.72 | 10.96 |
| 2008-07 | 219.016 | 216.028 | 334.055 | 0.71 | 1.26 | 3.86 |
| 2008-08 | 218.690 | 217.449 | 319.114 | -0.15 | 0.66 | -4.47 |
| 2008-09 | 218.877 | 218.757 | 321.466 | 0.09 | 0.60 | 0.74 |
| 2008-10 | 216.995 | 219.532 | 278.393 | -0.86 | 0.35 | -13.40 |
| 2008-11 | 213.153 | 219.662 | 191.822 | -1.77 | 0.06 | -31.10 |
| 2008-12 | 211.398 | 219.163 | 154.377 | -0.82 | -0.23 | -19.52 |
| 2009-01 | 211.933 | 218.953 | 160.815 | 0.25 | -0.10 | 4.17 |
| 2009-02 | 212.705 | 217.930 | 174.067 | 0.36 | -0.47 | 8.24 |
| 2009-03 | 212.495 | 216.949 | 166.814 | -0.10 | -0.45 | -4.17 |
| 2009-04 | 212.709 | 215.807 | 168.312 | 0.10 | -0.53 | 0.90 |
| 2009-05 | 213.022 | 215.064 | 177.057 | 0.15 | -0.34 | 5.20 |
| 2009-06 | 214.790 | 214.953 | 213.086 | 0.83 | -0.05 | 20.35 |
| 2009-07 | 214.726 | 214.047 | 211.649 | -0.03 | -0.42 | -0.67 |
| 2009-08 | 215.445 | 213.769 | 223.781 | 0.33 | -0.13 | 5.73 |
| 2009-09 | 215.861 | 213.299 | 226.214 | 0.19 | -0.22 | 1.09 |
| 2009-10 | 216.509 | 213.472 | 228.651 | 0.30 | 0.08 | 1.08 |
| 2009-11 | 217.234 | 213.383 | 238.246 | 0.33 | -0.04 | 4.20 |
| 2009-12 | 217.347 | 213.839 | 237.235 | 0.05 | 0.21 | -0.42 |
| 2010-01 | 217.488 | 214.738 | 242.036 | 0.06 | 0.42 | 2.02 |
| 2010-02 | 217.281 | 214.728 | 235.748 | -0.10 | -0.00 | -2.60 |
| 2010-03 | 217.353 | 215.550 | 233.103 | 0.03 | 0.38 | -1.12 |
| 2010-04 | 217.403 | 215.721 | 232.594 | 0.02 | 0.08 | -0.22 |
| 2010-05 | 217.290 | 215.717 | 227.765 | -0.05 | -0.00 | -2.08 |
| 2010-06 | 217.199 | 215.476 | 222.745 | -0.04 | -0.11 | -2.20 |
| 2010-07 | 217.605 | 215.451 | 229.026 | 0.19 | -0.01 | 2.82 |
| 2010-08 | 217.923 | 215.361 | 232.674 | 0.15 | -0.04 | 1.59 |
| 2010-09 | 218.275 | 216.166 | 235.661 | 0.16 | 0.37 | 1.28 |
| 2010-10 | 219.035 | 216.534 | 249.885 | 0.35 | 0.17 | 6.04 |
| 2010-11 | 219.590 | 217.105 | 256.596 | 0.25 | 0.26 | 2.69 |
| 2010-12 | 220.472 | 217.419 | 271.509 | 0.40 | 0.14 | 5.81 |
| 2011-01 | 221.187 | 219.251 | 275.816 | 0.32 | 0.84 | 1.59 |
| 2011-02 | 221.898 | 220.732 | 280.015 | 0.32 | 0.68 | 1.52 |
| 2011-03 | 223.046 | 223.193 | 294.915 | 0.52 | 1.11 | 5.32 |
| 2011-04 | 224.093 | 224.098 | 310.115 | 0.47 | 0.41 | 5.15 |
| 2011-05 | 224.806 | 225.295 | 314.859 | 0.32 | 0.53 | 1.53 |
| 2011-06 | 224.806 | 225.857 | 304.321 | 0.00 | 0.25 | -3.35 |
| 2011-07 | 225.395 | 227.178 | 304.901 | 0.26 | 0.58 | 0.19 |
| 2011-08 | 226.106 | 228.492 | 306.276 | 0.32 | 0.58 | 0.45 |
| 2011-09 | 226.597 | 229.927 | 309.168 | 0.22 | 0.63 | 0.94 |
| 2011-10 | 226.750 | 229.992 | 305.963 | 0.07 | 0.03 | -1.04 |
| 2011-11 | 227.169 | 229.947 | 308.587 | 0.18 | -0.02 | 0.86 |
| 2011-12 | 227.223 | 230.424 | 300.662 | 0.02 | 0.21 | -2.57 |
| 2012-01 | 227.842 | 230.948 | 306.170 | 0.27 | 0.23 | 1.83 |
| 2012-02 | 228.329 | 230.612 | 316.625 | 0.21 | -0.15 | 3.41 |
| 2012-03 | 228.807 | 231.051 | 319.198 | 0.21 | 0.19 | 0.81 |
| 2012-04 | 229.187 | 231.397 | 319.414 | 0.17 | 0.15 | 0.07 |
| 2012-05 | 228.713 | 231.320 | 303.692 | -0.21 | -0.03 | -4.92 |
| 2012-06 | 228.524 | 231.713 | 291.490 | -0.08 | 0.17 | -4.02 |
| 2012-07 | 228.590 | 231.658 | 287.505 | 0.03 | -0.02 | -1.37 |
| 2012-08 | 229.918 | 231.853 | 310.365 | 0.58 | 0.08 | 7.95 |
| 2012-09 | 231.015 | 231.789 | 326.789 | 0.48 | -0.03 | 5.29 |
| 2012-10 | 231.638 | 232.398 | 332.699 | 0.27 | 0.26 | 1.81 |
| 2012-11 | 231.249 | 232.883 | 315.264 | -0.17 | 0.21 | -5.24 |
| 2012-12 | 231.221 | 233.374 | 306.338 | -0.01 | 0.21 | -2.83 |
| 2013-01 | 231.679 | 233.696 | 306.734 | 0.20 | 0.14 | 0.13 |
| 2013-02 | 232.937 | 233.526 | 329.253 | 0.54 | -0.07 | 7.34 |
| 2013-03 | 232.282 | 233.580 | 310.442 | -0.28 | 0.02 | -5.71 |
| 2013-04 | 231.797 | 233.776 | 295.206 | -0.21 | 0.08 | -4.91 |
| 2013-05 | 231.893 | 233.184 | 293.131 | 0.04 | -0.25 | -0.70 |
| 2013-06 | 232.445 | 233.809 | 298.112 | 0.24 | 0.27 | 1.70 |
| 2013-07 | 232.900 | 233.893 | 298.754 | 0.20 | 0.04 | 0.22 |
| 2013-08 | 233.456 | 234.073 | 303.409 | 0.24 | 0.08 | 1.56 |
| 2013-09 | 233.544 | 234.040 | 297.390 | 0.04 | -0.01 | -1.98 |
| 2013-10 | 233.669 | 234.219 | 295.640 | 0.05 | 0.08 | -0.59 |
| 2013-11 | 234.100 | 234.144 | 297.183 | 0.18 | -0.03 | 0.52 |
| 2013-12 | 234.719 | 234.318 | 303.304 | 0.26 | 0.07 | 2.06 |
| 2014-01 | 235.288 | 234.722 | 308.400 | 0.24 | 0.17 | 1.68 |
| 2014-02 | 235.547 | 235.781 | 305.007 | 0.11 | 0.45 | -1.10 |
| 2014-03 | 236.028 | 237.055 | 300.141 | 0.20 | 0.54 | -1.60 |
| 2014-04 | 236.468 | 237.942 | 305.367 | 0.19 | 0.37 | 1.74 |
| 2014-05 | 236.918 | 239.611 | 301.296 | 0.19 | 0.70 | -1.33 |
| 2014-06 | 237.231 | 239.682 | 302.293 | 0.13 | 0.03 | 0.33 |
| 2014-07 | 237.498 | 240.154 | 299.785 | 0.11 | 0.20 | -0.83 |
| 2014-08 | 237.460 | 240.692 | 294.803 | -0.02 | 0.22 | -1.66 |
| 2014-09 | 237.477 | 241.328 | 287.003 | 0.01 | 0.26 | -2.65 |
| 2014-10 | 237.430 | 241.620 | 278.463 | -0.02 | 0.12 | -2.98 |
| 2014-11 | 236.983 | 241.912 | 262.282 | -0.19 | 0.12 | -5.81 |
| 2014-12 | 236.252 | 242.893 | 238.491 | -0.31 | 0.41 | -9.07 |
| 2015-01 | 234.747 | 242.553 | 199.553 | -0.64 | -0.14 | -16.33 |
| 2015-02 | 235.342 | 242.598 | 206.901 | 0.25 | 0.02 | 3.68 |
| 2015-03 | 235.976 | 241.633 | 214.684 | 0.27 | -0.40 | 3.76 |
| 2015-04 | 236.222 | 241.106 | 211.577 | 0.10 | -0.22 | -1.45 |
| 2015-05 | 237.001 | 241.107 | 225.281 | 0.33 | 0.00 | 6.48 |
| 2015-06 | 237.657 | 241.922 | 230.871 | 0.28 | 0.34 | 2.48 |
| 2015-07 | 238.034 | 242.250 | 231.775 | 0.16 | 0.14 | 0.39 |
| 2015-08 | 238.033 | 242.864 | 225.725 | -0.00 | 0.25 | -2.61 |
| 2015-09 | 237.498 | 243.198 | 201.935 | -0.22 | 0.14 | -10.54 |
| 2015-10 | 237.733 | 243.284 | 199.315 | 0.10 | 0.04 | -1.30 |
| 2015-11 | 238.017 | 242.606 | 198.984 | 0.12 | -0.28 | -0.17 |
| 2015-12 | 237.761 | 241.880 | 190.765 | -0.11 | -0.30 | -4.13 |
| 2016-01 | 237.652 | 241.558 | 181.445 | -0.05 | -0.13 | -4.89 |
| 2016-02 | 237.336 | 241.741 | 162.727 | -0.13 | 0.08 | -10.32 |
| 2016-03 | 238.080 | 240.414 | 175.164 | 0.31 | -0.55 | 7.64 |
| 2016-04 | 238.992 | 240.341 | 184.762 | 0.38 | -0.03 | 5.48 |
| 2016-05 | 239.557 | 239.348 | 187.627 | 0.24 | -0.41 | 1.55 |
| 2016-06 | 240.222 | 238.763 | 196.440 | 0.28 | -0.24 | 4.70 |
| 2016-07 | 240.101 | 238.380 | 185.486 | -0.05 | -0.16 | -5.58 |
| 2016-08 | 240.545 | 238.133 | 183.715 | 0.18 | -0.10 | -0.95 |
| 2016-09 | 241.176 | 237.880 | 189.766 | 0.26 | -0.11 | 3.29 |
| 2016-10 | 241.741 | 237.714 | 197.788 | 0.23 | -0.07 | 4.23 |
| 2016-11 | 242.026 | 237.438 | 199.220 | 0.12 | -0.12 | 0.72 |
| 2016-12 | 242.637 | 237.147 | 206.244 | 0.25 | -0.12 | 3.53 |
| 2017-01 | 243.618 | 237.072 | 217.892 | 0.40 | -0.03 | 5.65 |
| 2017-02 | 244.006 | 237.824 | 213.626 | 0.16 | 0.32 | -1.96 |
| 2017-03 | 243.892 | 238.387 | 210.690 | -0.05 | 0.24 | -1.37 |
| 2017-04 | 244.193 | 238.568 | 209.074 | 0.12 | 0.08 | -0.77 |
| 2017-05 | 244.004 | 238.893 | 197.848 | -0.08 | 0.14 | -5.37 |
| 2017-06 | 244.163 | 238.494 | 195.797 | 0.07 | -0.17 | -1.04 |
| 2017-07 | 244.243 | 238.904 | 191.889 | 0.03 | 0.17 | -2.00 |
| 2017-08 | 245.183 | 238.804 | 203.585 | 0.38 | -0.04 | 6.10 |
| 2017-09 | 246.435 | 238.852 | 228.252 | 0.51 | 0.02 | 12.12 |
| 2017-10 | 246.626 | 239.020 | 218.990 | 0.08 | 0.07 | -4.06 |
| 2017-11 | 247.284 | 238.940 | 228.908 | 0.27 | -0.03 | 4.53 |
| 2017-12 | 247.805 | 239.371 | 228.888 | 0.21 | 0.18 | -0.01 |
| 2018-01 | 248.859 | 239.854 | 235.325 | 0.43 | 0.20 | 2.81 |
| 2018-02 | 249.529 | 239.187 | 239.767 | 0.27 | -0.28 | 1.89 |
| 2018-03 | 249.577 | 239.149 | 231.325 | 0.02 | -0.02 | -3.52 |
| 2018-04 | 250.227 | 239.541 | 238.803 | 0.26 | 0.16 | 3.23 |
| 2018-05 | 250.792 | 238.884 | 242.344 | 0.23 | -0.27 | 1.48 |
| 2018-06 | 251.018 | 239.048 | 243.105 | 0.09 | 0.07 | 0.31 |
| 2018-07 | 251.214 | 239.565 | 241.377 | 0.08 | 0.22 | -0.71 |
| 2018-08 | 251.663 | 239.795 | 246.229 | 0.18 | 0.10 | 2.01 |
| 2018-09 | 252.182 | 239.967 | 250.369 | 0.21 | 0.07 | 1.68 |
| 2018-10 | 252.772 | 239.558 | 253.471 | 0.23 | -0.17 | 1.24 |
| 2018-11 | 252.594 | 240.227 | 238.309 | -0.07 | 0.28 | -5.98 |
| 2018-12 | 252.767 | 241.137 | 225.063 | 0.07 | 0.38 | -5.56 |
| 2019-01 | 252.561 | 241.581 | 208.730 | -0.08 | 0.18 | -7.26 |
| 2019-02 | 253.319 | 242.111 | 217.237 | 0.30 | 0.22 | 4.08 |
| 2019-03 | 254.277 | 242.482 | 230.013 | 0.38 | 0.15 | 5.88 |
| 2019-04 | 255.233 | 241.219 | 245.651 | 0.38 | -0.52 | 6.80 |
| 2019-05 | 255.296 | 241.642 | 242.557 | 0.02 | 0.18 | -1.26 |
| 2019-06 | 255.213 | 241.214 | 231.691 | -0.03 | -0.18 | -4.48 |
| 2019-07 | 255.802 | 240.988 | 235.098 | 0.23 | -0.09 | 1.47 |
| 2019-08 | 256.036 | 240.943 | 229.734 | 0.09 | -0.02 | -2.28 |
| 2019-09 | 256.430 | 241.409 | 228.230 | 0.15 | 0.19 | -0.65 |
| 2019-10 | 257.155 | 241.999 | 232.348 | 0.28 | 0.24 | 1.80 |
| 2019-11 | 257.879 | 242.726 | 236.924 | 0.28 | 0.30 | 1.97 |
| 2019-12 | 258.630 | 242.887 | 244.197 | 0.29 | 0.07 | 3.07 |
| 2020-01 | 259.127 | 243.511 | 242.397 | 0.19 | 0.26 | -0.74 |
| 2020-02 | 259.250 | 244.200 | 230.646 | 0.05 | 0.28 | -4.85 |
| 2020-03 | 258.076 | 245.017 | 204.901 | -0.45 | 0.33 | -11.16 |
| 2020-04 | 256.032 | 251.063 | 164.836 | -0.79 | 2.47 | -19.55 |
| 2020-05 | 255.802 | 253.230 | 160.261 | -0.09 | 0.86 | -2.78 |
| 2020-06 | 257.042 | 254.674 | 178.169 | 0.48 | 0.57 | 11.17 |
| 2020-07 | 258.352 | 252.003 | 185.072 | 0.51 | -1.05 | 3.87 |
| 2020-08 | 259.316 | 252.148 | 188.325 | 0.37 | 0.06 | 1.76 |
| 2020-09 | 259.997 | 251.166 | 193.069 | 0.26 | -0.39 | 2.52 |
| 2020-10 | 260.319 | 251.641 | 191.525 | 0.12 | 0.19 | -0.80 |
| 2020-11 | 260.911 | 251.365 | 191.823 | 0.23 | -0.11 | 0.16 |
| 2020-12 | 262.045 | 252.536 | 208.753 | 0.43 | 0.47 | 8.83 |
| 2021-01 | 262.687 | 252.541 | 223.567 | 0.24 | 0.00 | 7.10 |
| 2021-02 | 263.579 | 252.822 | 234.713 | 0.34 | 0.11 | 4.99 |
| 2021-03 | 264.961 | 252.933 | 254.403 | 0.52 | 0.04 | 8.39 |
| 2021-04 | 266.614 | 254.125 | 246.052 | 0.62 | 0.47 | -3.28 |
| 2021-05 | 268.383 | 255.043 | 249.382 | 0.66 | 0.36 | 1.35 |
| 2021-06 | 270.654 | 257.058 | 256.305 | 0.85 | 0.79 | 2.78 |
| 2021-07 | 271.903 | 258.491 | 260.515 | 0.46 | 0.56 | 1.64 |
| 2021-08 | 272.676 | 259.613 | 266.871 | 0.28 | 0.43 | 2.44 |
| 2021-09 | 273.910 | 262.459 | 273.260 | 0.45 | 1.10 | 2.39 |
| 2021-10 | 276.550 | 265.084 | 286.527 | 0.96 | 1.00 | 4.86 |
| 2021-11 | 278.919 | 267.473 | 305.127 | 0.86 | 0.90 | 6.49 |
| 2021-12 | 280.845 | 268.985 | 313.591 | 0.69 | 0.57 | 2.77 |
| 2022-01 | 282.543 | 271.176 | 312.894 | 0.60 | 0.81 | -0.22 |
| 2022-02 | 284.500 | 274.728 | 323.330 | 0.69 | 1.31 | 3.34 |
| 2022-03 | 287.674 | 278.333 | 375.953 | 1.12 | 1.31 | 16.28 |
| 2022-04 | 288.561 | 281.593 | 352.960 | 0.31 | 1.17 | -6.12 |
| 2022-05 | 291.298 | 285.522 | 371.340 | 0.95 | 1.40 | 5.21 |
| 2022-06 | 294.957 | 288.568 | 409.671 | 1.26 | 1.07 | 10.32 |
| 2022-07 | 294.913 | 292.455 | 375.422 | -0.01 | 1.35 | -8.36 |
| 2022-08 | 295.097 | 294.884 | 335.333 | 0.06 | 0.83 | -10.68 |
| 2022-09 | 296.349 | 296.403 | 322.853 | 0.42 | 0.52 | -3.72 |
| 2022-10 | 298.007 | 297.966 | 337.263 | 0.56 | 0.53 | 4.46 |
| 2022-11 | 298.786 | 299.449 | 336.273 | 0.26 | 0.50 | -0.29 |
| 2022-12 | 298.832 | 300.576 | 309.091 | 0.02 | 0.38 | -8.08 |
| 2023-01 | 300.420 | 301.676 | 317.380 | 0.53 | 0.37 | 2.68 |
| 2023-02 | 301.450 | 302.444 | 316.327 | 0.34 | 0.25 | -0.33 |
| 2023-03 | 301.821 | 301.467 | 309.776 | 0.12 | -0.32 | -2.07 |
| 2023-04 | 302.845 | 301.811 | 309.412 | 0.34 | 0.11 | -0.12 |
| 2023-05 | 303.334 | 302.184 | 298.832 | 0.16 | 0.12 | -3.42 |
| 2023-06 | 304.014 | 302.057 | 301.426 | 0.22 | -0.04 | 0.87 |
| 2023-07 | 304.609 | 302.984 | 300.625 | 0.20 | 0.31 | -0.27 |
| 2023-08 | 306.082 | 303.631 | 323.701 | 0.48 | 0.21 | 7.68 |
| 2023-09 | 307.276 | 303.449 | 332.732 | 0.39 | -0.06 | 2.79 |
| 2023-10 | 307.696 | 304.366 | 320.296 | 0.14 | 0.30 | -3.74 |
| 2023-11 | 308.148 | 304.332 | 306.714 | 0.15 | -0.01 | -4.24 |
| 2023-12 | 308.741 | 304.505 | 303.319 | 0.19 | 0.06 | -1.11 |
| 2024-01 | 309.698 | 305.187 | 297.154 | 0.31 | 0.22 | -2.03 |
| 2024-02 | 310.967 | 305.432 | 303.183 | 0.41 | 0.08 | 2.03 |
| 2024-03 | 312.345 | 305.010 | 313.054 | 0.44 | -0.14 | 3.26 |
| 2024-04 | 313.023 | 305.354 | 312.728 | 0.22 | 0.11 | -0.10 |
| 2024-05 | 313.175 | 305.414 | 305.909 | 0.05 | 0.02 | -2.18 |
| 2024-06 | 313.044 | 305.582 | 294.143 | -0.04 | 0.06 | -3.85 |
| 2024-07 | 313.569 | 306.285 | 294.025 | 0.17 | 0.23 | -0.04 |
| 2024-08 | 314.062 | 306.399 | 290.263 | 0.16 | 0.04 | -1.28 |
| 2024-09 | 314.732 | 307.258 | 282.057 | 0.21 | 0.28 | -2.83 |
| 2024-10 | 315.631 | 307.867 | 281.588 | 0.29 | 0.20 | -0.17 |
| 2024-11 | 316.528 | 309.093 | 281.939 | 0.28 | 0.40 | 0.12 |
| 2024-12 | 317.604 | 309.767 | 293.155 | 0.34 | 0.22 | 3.98 |
| 2025-01 | 318.961 | 310.817 | 296.780 | 0.43 | 0.34 | 1.24 |
| 2025-02 | 319.679 | 310.955 | 293.232 | 0.23 | 0.04 | -1.20 |
| 2025-03 | 319.785 | 312.154 | 282.129 | 0.03 | 0.39 | -3.79 |
| 2025-04 | 320.302 | 311.440 | 275.454 | 0.16 | -0.23 | -2.37 |
| 2025-05 | 320.620 | 312.296 | 269.584 | 0.10 | 0.27 | -2.13 |
| 2025-06 | 321.435 | 312.982 | 269.865 | 0.25 | 0.22 | 0.10 |
| 2025-07 | 322.169 | 313.035 | 266.542 | 0.23 | 0.02 | -1.23 |
| 2025-08 | 323.291 | 314.647 | 270.922 | 0.35 | 0.51 | 1.64 |
| 2025-09 | 324.245 | 315.540 | 280.658 | 0.30 | 0.28 | 3.59 |
| 2025-10 | 276.991 | -1.31 | ||||
| 2025-11 | 325.063 | 315.000 | 284.560 | 2.73 | ||
| 2025-12 | 326.031 | 316.982 | 283.599 | 0.30 | 0.63 | -0.34 |
| 2026-01 | 326.588 | 317.589 | 274.547 | 0.17 | 0.19 | -3.19 |
| 2026-02 | 327.460 | 318.985 | 276.754 | 0.27 | 0.44 | 0.80 |
| 2026-03 | 330.293 | 318.462 | 335.500 | 0.87 | -0.16 | 21.23 |
| 2026-04 | 332.407 | 320.633 | 353.740 | 0.64 | 0.68 | 5.44 |
| 2026-05 | 333.979 | 320.836 | 378.660 | 0.47 | 0.06 | 7.04 |
| 2026-06 | 332.568 | 321.446 | 341.980 | -0.42 | 0.19 | -9.69 |
| 2026-07 | 332.813 | 321.216 | 332.215 | 0.07 | -0.07 | -2.86 |
| 2026-08 | 334.131 | 321.335 | 345.169 | 0.40 | 0.04 | 3.90 |
| 2026-09 | 336.298 | 321.111 | 376.558 | 0.65 | -0.07 | 9.09 |
| Year | Annual Average CPI-U | Change from Prior Year |
|---|---|---|
| 1913 | 9.883 | |
| 1914 | 10.017 | 1.35% |
| 1915 | 10.108 | 0.92% |
| 1916 | 10.883 | 7.67% |
| 1917 | 12.825 | 17.84% |
| 1918 | 15.042 | 17.28% |
| 1919 | 17.333 | 15.24% |
| 1920 | 20.042 | 15.63% |
| 1921 | 17.850 | -10.94% |
| 1922 | 16.750 | -6.16% |
| 1923 | 17.050 | 1.79% |
| 1924 | 17.125 | 0.44% |
| 1925 | 17.542 | 2.43% |
| 1926 | 17.700 | 0.90% |
| 1927 | 17.358 | -1.93% |
| 1928 | 17.158 | -1.15% |
| 1929 | 17.158 | 0.00% |
| 1930 | 16.700 | -2.67% |
| 1931 | 15.208 | -8.93% |
| 1932 | 13.642 | -10.30% |
| 1933 | 12.933 | -5.19% |
| 1934 | 13.383 | 3.48% |
| 1935 | 13.725 | 2.55% |
| 1936 | 13.867 | 1.03% |
| 1937 | 14.383 | 3.73% |
| 1938 | 14.092 | -2.03% |
| 1939 | 13.908 | -1.30% |
| 1940 | 14.008 | 0.72% |
| 1941 | 14.725 | 5.12% |
| 1942 | 16.333 | 10.92% |
| 1943 | 17.308 | 5.97% |
| 1944 | 17.592 | 1.64% |
| 1945 | 17.992 | 2.27% |
| 1946 | 19.517 | 8.48% |
| 1947 | 22.325 | 14.39% |
| 1948 | 24.042 | 7.69% |
| 1949 | 23.808 | -0.97% |
| 1950 | 24.067 | 1.09% |
| 1951 | 25.958 | 7.86% |
| 1952 | 26.550 | 2.28% |
| 1953 | 26.767 | 0.82% |
| 1954 | 26.850 | 0.31% |
| 1955 | 26.775 | -0.28% |
| 1956 | 27.183 | 1.53% |
| 1957 | 28.092 | 3.34% |
| 1958 | 28.858 | 2.73% |
| 1959 | 29.150 | 1.01% |
| 1960 | 29.575 | 1.46% |
| 1961 | 29.892 | 1.07% |
| 1962 | 30.250 | 1.20% |
| 1963 | 30.625 | 1.24% |
| 1964 | 31.017 | 1.28% |
| 1965 | 31.508 | 1.59% |
| 1966 | 32.458 | 3.02% |
| 1967 | 33.358 | 2.77% |
| 1968 | 34.783 | 4.27% |
| 1969 | 36.683 | 5.46% |
| 1970 | 38.825 | 5.84% |
| 1971 | 40.492 | 4.29% |
| 1972 | 41.817 | 3.27% |
| 1973 | 44.400 | 6.18% |
| 1974 | 49.308 | 11.05% |
| 1975 | 53.817 | 9.14% |
| 1976 | 56.908 | 5.74% |
| 1977 | 60.608 | 6.50% |
| 1978 | 65.233 | 7.63% |
| 1979 | 72.575 | 11.25% |
| 1980 | 82.408 | 13.55% |
| 1981 | 90.925 | 10.33% |
| 1982 | 96.500 | 6.13% |
| 1983 | 99.600 | 3.21% |
| 1984 | 103.883 | 4.30% |
| 1985 | 107.567 | 3.55% |
| 1986 | 109.608 | 1.90% |
| 1987 | 113.625 | 3.66% |
| 1988 | 118.258 | 4.08% |
| 1989 | 123.967 | 4.83% |
| 1990 | 130.658 | 5.40% |
| 1991 | 136.192 | 4.23% |
| 1992 | 140.317 | 3.03% |
| 1993 | 144.458 | 2.95% |
| 1994 | 148.225 | 2.61% |
| 1995 | 152.383 | 2.81% |
| 1996 | 156.850 | 2.93% |
| 1997 | 160.517 | 2.34% |
| 1998 | 163.008 | 1.55% |
| 1999 | 166.575 | 2.19% |
| 2000 | 172.200 | 3.38% |
| 2001 | 177.067 | 2.83% |
| 2002 | 179.875 | 1.59% |
| 2003 | 183.958 | 2.27% |
| 2004 | 188.883 | 2.68% |
| 2005 | 195.292 | 3.39% |
| 2006 | 201.592 | 3.23% |
| 2007 | 207.342 | 2.85% |
| 2008 | 215.303 | 3.84% |
| 2009 | 214.537 | -0.36% |
| 2010 | 218.055 | 1.64% |
| 2011 | 224.939 | 3.16% |
| 2012 | 229.594 | 2.07% |
| 2013 | 232.957 | 1.46% |
| 2014 | 236.736 | 1.62% |
| 2015 | 237.017 | 0.12% |
| 2016 | 240.007 | 1.26% |
| 2017 | 245.120 | 2.13% |
| 2018 | 251.107 | 2.44% |
| 2019 | 255.657 | 1.81% |
| 2020 | 258.811 | 1.23% |
| 2021 | 270.970 | 4.70% |
| 2022 | 292.655 | 8.00% |
| 2023 | 304.702 | 4.12% |
| 2024 | 313.689 | 2.95% |
| 2025 | 321.943 | 2.63% |
| 2026* | 332.243 | 3.20% |
| Data Element | Publisher | Series / Document | Accessed |
|---|---|---|---|
| Headline, core, energy, food, shelter CPI (NSA) | BLS | CUUR0000SA0, SA0L1E, SA0E, SAF1, SAH1, SA0LE | 2026-10-15 |
| Seasonally adjusted CPI | BLS | CUSR0000SA0, SAF11, SETB01, SA0LE | 2026-10-15 |
| CPI history 1913–2026 | BLS | CUUR0000SA0 (cu.data.1.AllItems) | 2026-10-15 |
| Retail prices | BLS | APU000074714, APU0000702111, APU0000703112, APU0000706111, APU0000708111, APU0000709112, APU0000711211 | 2026-10-15 |
| September 2026 validation | BLS | CPI news release, Oct 14, 2026 | 2026-10-15 |
| Recession dates | NBER | Business cycle expansions and contractions | 2026-10-15 |
| Supply-chain pressure | Federal Reserve Bank of New York | GSCPI data file | 2026-10-15 |
| Iran war dates and oil disruption | CRS; EIA | CRS Insight IN12662; EIA press releases 584 and 590 | 2026-10-15 |
| Inflation research | FRBSF; Brookings; CBO | Economic Letters 2022-07, 2022-15; Bernanke & Blanchard (2023); CBO letter 58357 | 2026-10-15 |
References
Sources are organized by the sections of this article they principally inform. Citations follow APA 7th Edition format. Data were downloaded directly from the publishing agency; news and fact-check articles were used only as leads and are not cited as evidence.
Price Data — Sections 1 through 8
U.S. Bureau of Labor Statistics. (2026a). Consumer Price Index for All Urban Consumers (CPI-U), U.S. city average: bulk time-series files [Data set]. https://download.bls.gov/pub/time.series/cu/
Primary source for every CPI figure: all items (CUUR0000SA0, CUSR0000SA0), core (SA0L1E), all items less energy (SA0LE), energy (SA0E), food (SAF1), food at home (SAF11), shelter (SAH1), and gasoline (SETB01), monthly from 1913 through September 2026. Downloaded October 15, 2026. October 2025 was not published.
U.S. Bureau of Labor Statistics. (2026b, October 14). Consumer Price Index — September 2026 [News release]. https://www.bls.gov/news.release/cpi.nr0.htm
Confirms the September 2026 index level (336.940), the 3.7% 12-month increase, energy up 20.4%, gasoline up 34.2%, and core up 2.6%. Used to validate the bulk data.
U.S. Bureau of Labor Statistics. (2026c). Average Price Data, U.S. city average: bulk time-series files [Data set]. https://download.bls.gov/pub/time.series/ap/
Retail prices for regular gasoline and grocery staples (Sections 4, 7, and 8). Not seasonally adjusted.
Causes of the 2021–2022 Surge — Section 5
Jordà, Ò., Liu, C., Nechio, F., & Rivera-Reyes, F. (2022, March 28). Why is U.S. inflation higher than in other countries? (FRBSF Economic Letter 2022-07). Federal Reserve Bank of San Francisco. https://www.frbsf.org/research-and-insights/publications/economic-letter/2022/03/why-is-us-inflation-higher-than-in-other-countries/
Estimates U.S. pandemic income-support measures raised inflation about 3 percentage points by the end of 2021. Covers transfers enacted in 2020 and 2021.
Shapiro, A. H. (2022, June 21). How much do supply and demand drive inflation? (FRBSF Economic Letter 2022-15). Federal Reserve Bank of San Francisco. https://www.frbsf.org/research-and-insights/publications/economic-letter/2022/06/how-much-do-supply-and-demand-drive-inflation/
Attributes a little more than half of the 2022 inflation gap to supply factors and about one-third to demand factors.
Bernanke, B. S., & Blanchard, O. (2023, June 13). What caused the U.S. pandemic-era inflation? Brookings Institution. https://www.brookings.edu/articles/what-caused-the-u-s-pandemic-era-inflation/
Finds most of the rise came from price shocks (commodities, sector shortages). Fiscal policy contributed through demand for goods in short supply; labor-market tightness grew in importance later.
Congressional Budget Office. (2022, August 4). Economic analysis of budget reconciliation legislation [Letter to Sen. Lindsey Graham]. https://www.cbo.gov/system/files/2022-08/58357-Graham.pdf
States the Inflation Reduction Act would have a “negligible effect on inflation” in 2022 and between −0.1 and +0.1 percentage point in 2023.
Congress.gov. (2021). H.R. 1319 — American Rescue Plan Act of 2021, all actions. Library of Congress. https://www.congress.gov/bill/117th-congress/house-bill/1319/all-actions
Signed March 11, 2021 (Public Law 117-2). Senate passed 50–49 (March 6) and House agreed 220–211 (March 10). CBO estimated a $1.86 trillion deficit increase (https://www.cbo.gov/system/files/2021-03/Estimated_Budgetary_Effects_of_HR_1319_as_passed_0.pdf).
Federal Reserve Bank of New York. (2026). Global Supply Chain Pressure Index [Data set]. https://www.newyorkfed.org/research/policy/gscpi
Monthly index of global supply-chain stress used in the Supply Chains tab. October 2026 vintage.
Office of the Clerk, U.S. House of Representatives. (2021, March 10). Roll Call 72: On motion to concur in the Senate amendment, American Rescue Plan Act. https://clerk.house.gov/Votes/202172
Party breakdown of the final House vote: Democrats 220 yea and 1 nay; Republicans 0 yea and 210 nay.
Price History and Recessions — Section 6
National Bureau of Economic Research. (2023). US business cycle expansions and contractions. https://www.nber.org/research/data/us-business-cycle-expansions-and-contractions
Official recession peak and trough dates, 1913–2020, matched against every CPI deflation episode.
Energy Shock of 2026 — Section 7
U.S. Energy Information Administration. (2026a, March 10). Short-Term Energy Outlook press release. https://www.eia.gov/pressroom/releases/press584.php
Reports that crude oil prices rose as petroleum shipments through the Strait of Hormuz fell following the onset of military action in the Middle East.
U.S. Energy Information Administration. (2026b, July 7). EIA increases global oil production forecast after the U.S.–Iran agreement [Press release]. https://www.eia.gov/pressroom/releases/press590.php
Documents the June 18, 2026, U.S.–Iran memorandum of understanding to end the conflict and reopen the Strait of Hormuz. (A separate EIA Today in Energy article dated July 15, 2026, gives the signing date as June 17.)
Congressional Research Service. (2026). U.S. and Israeli military operations against Iran: Issues for Congress (CRS Insight IN12662). Library of Congress. https://www.congress.gov/crs-product/IN12662
States that the United States and Israel launched military operations against Iran on February 28, 2026. Source for the war start date used in Sections 5 and 7.
Minton, R., Ray, M., & Somale, M. (2026, April 8). Detecting tariff effects on consumer prices in real time – Part II (FEDS Notes). Board of Governors of the Federal Reserve System. https://www.federalreserve.gov/econres/notes/feds-notes/detecting-tariff-effects-on-consumer-prices-in-real-time-part-II-20260408.html
Estimates tariffs implemented through November 2025 raised core goods PCE prices 3.1% and overall core PCE prices 0.8% through February 2026. Measures PCE prices, not CPI.