

Research, Analysis, Posts, and Releases
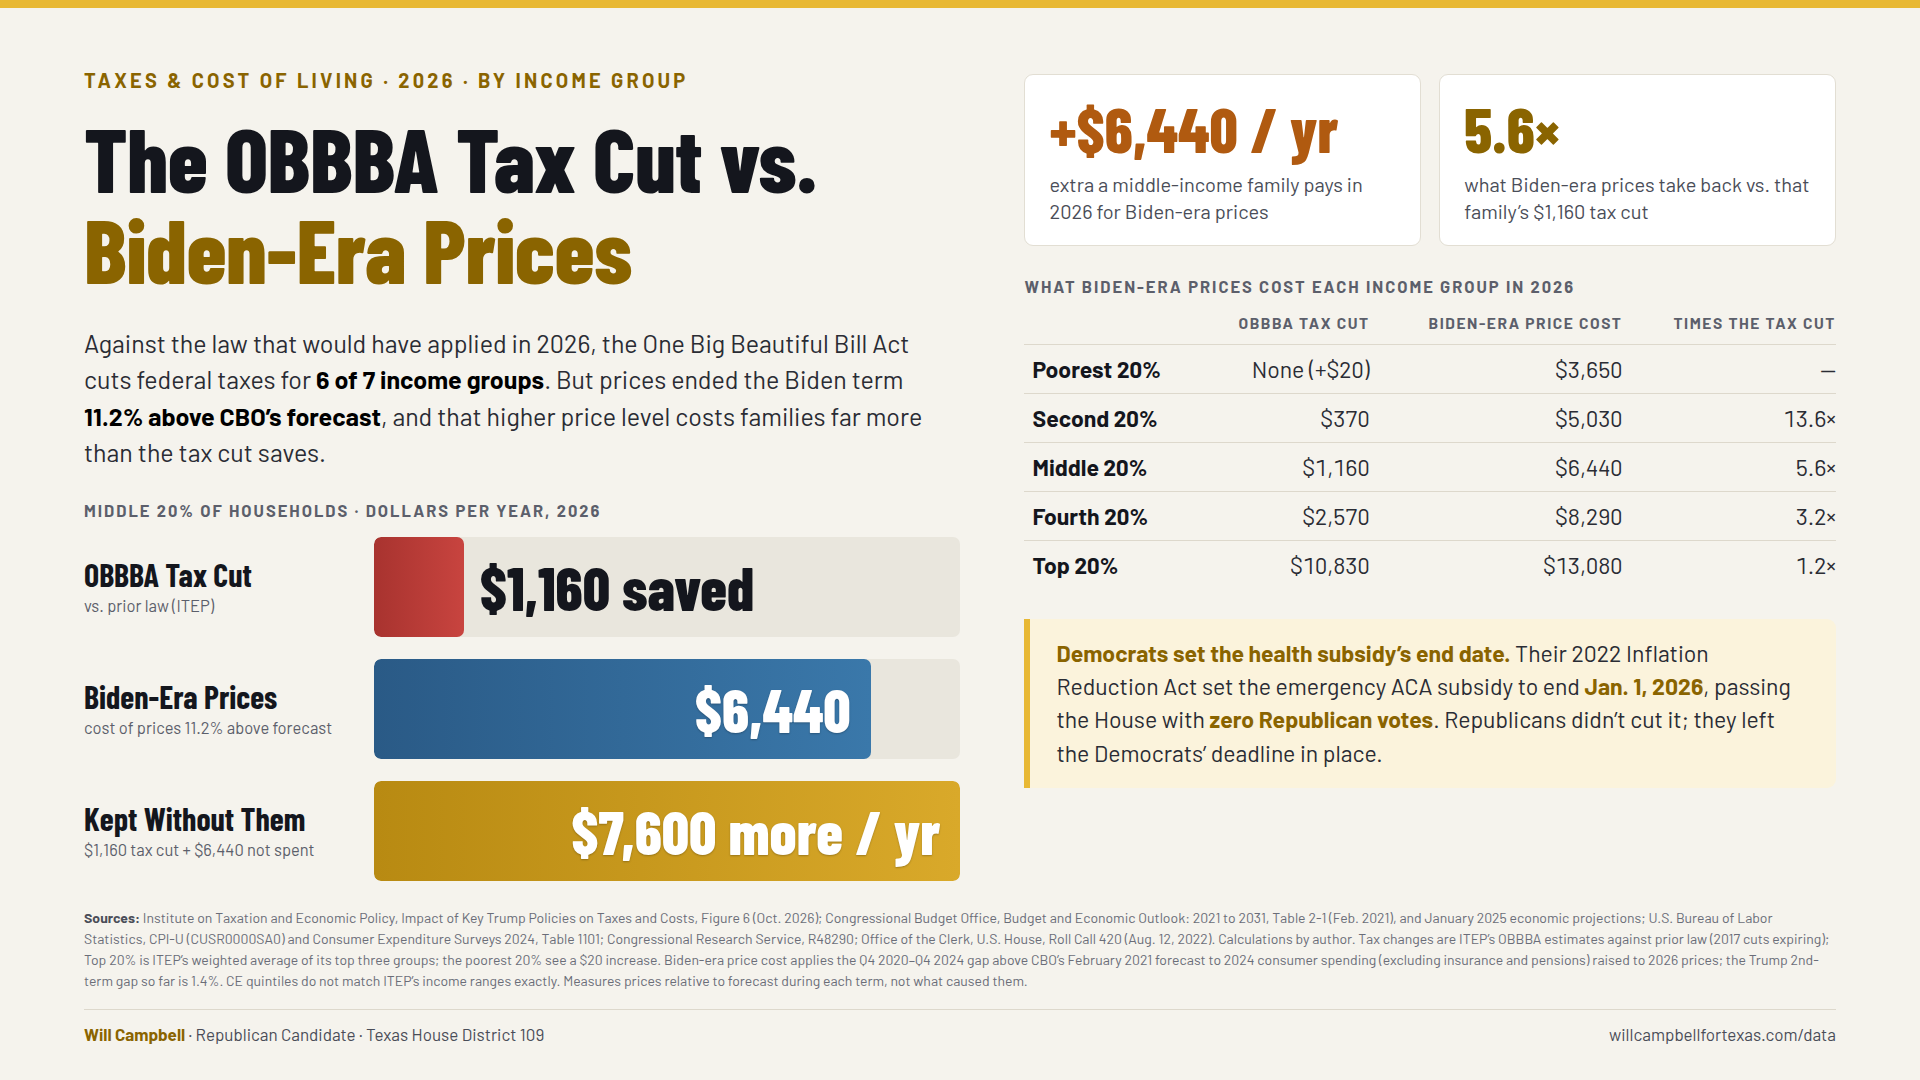
Who Is Really Paying More? What the “OBBBA” Impact Actually Was
The One Big Beautiful Bill Act cut 2026 federal taxes for six of seven income groups, including $1,160 for a middle-income family. Using ITEP, CBO, and BLS data, we break down what households gained, what the health-credit expiration and higher prices cost, and why the Biden-era price increase still costs most families more than the tax cut saves.
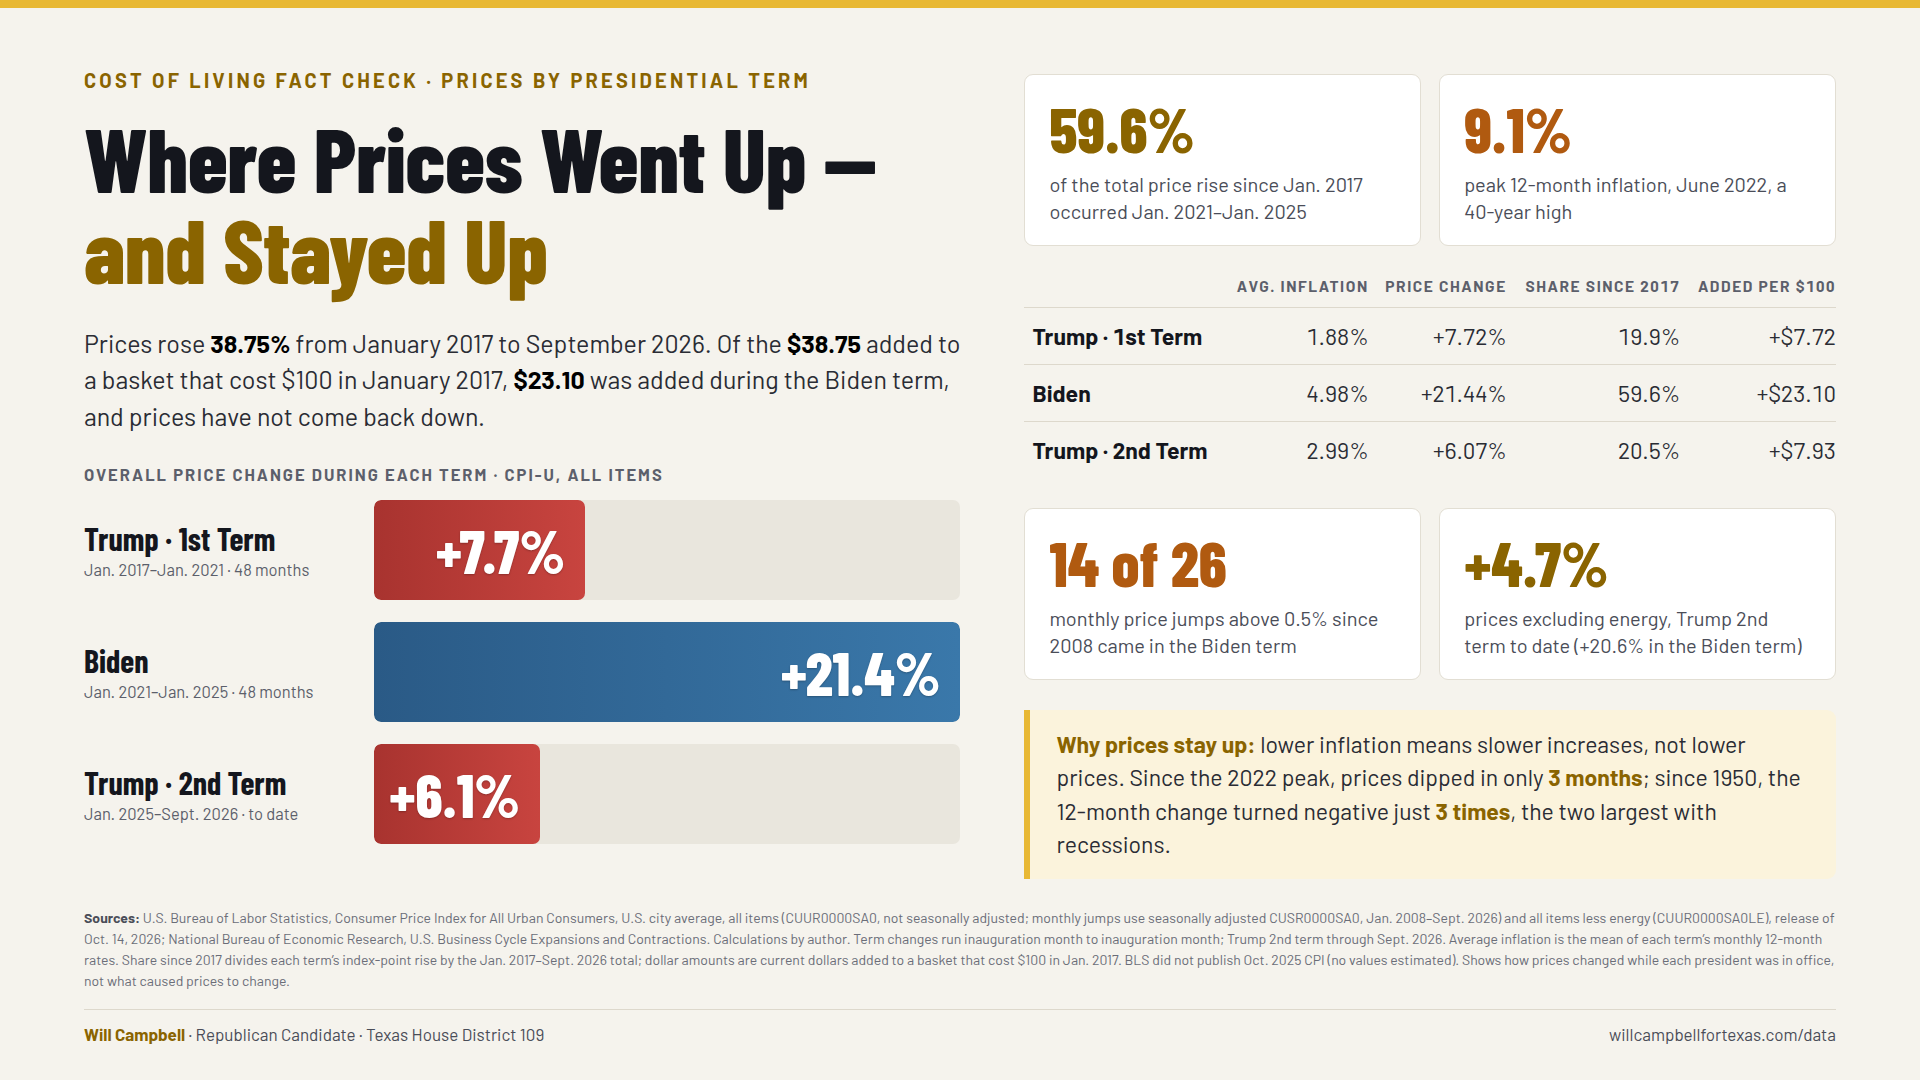
Where Prices Went Up — and Why They Never Came Back Down: Inflation Under Trump, Biden, and Trump Again
Was inflation really worse under Biden than under Trump? We checked the viral “average inflation” graphic against Bureau of Labor Statistics data through September 2026, and it holds up: 1.9% under Trump’s first term, 5.0% under Biden, and 2.9% under Trump’s second term. The bigger story is the price level. Prices rose 21.4% from January 2021 to January 2025, which is 59.6% of the entire increase since January 2017. Inflation peaked at 9.1% in June 2022, and those higher prices never came back down. This report covers the month-by-month data with and without gasoline, what drove the 2021–2022 surge, the 2026 Iran-war energy shock, and what prices would be today if the Biden-era increase had not happened.